
Information for investors
Share price since 6 March 2006 (first trading day)
Total shareholder return +105.2% (SPI Total Shareholder Return: 111.7%)
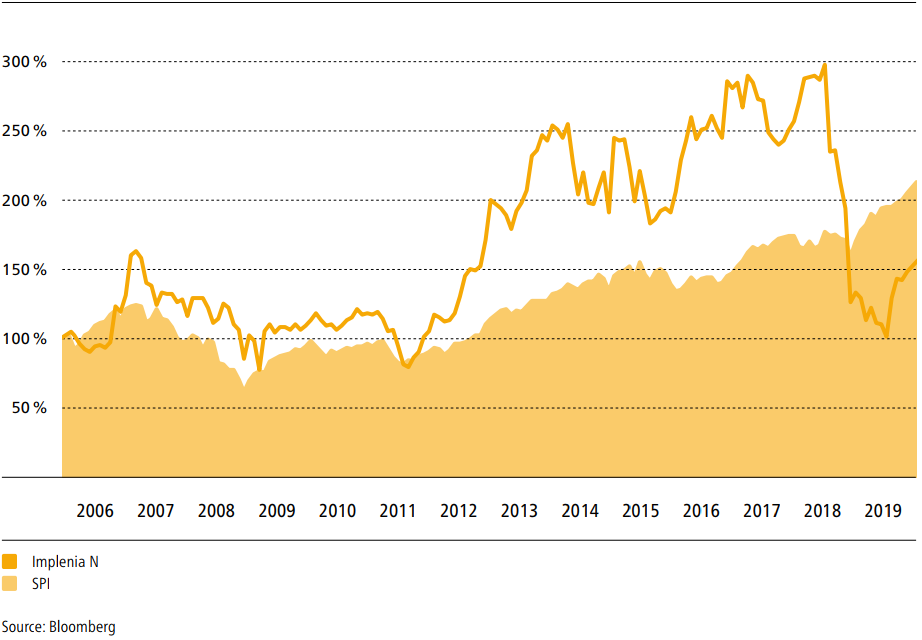
Information about Implenia’s shares
Review
Average trading volume increased to around 100,000 shares per day in 2019, compared with 54,000 in the previous year. This increased the shares’ average daily liquidity by CHF 0.1 million to CHF 3.3 million. In 2019, the free float went down 5.3% to 73%.
Share performance | ||||||||||
2019 | 2018 | 2017 | 2016 | 2015 | ||||||
Year-high (in CHF per share) | 40.74 | 81.05 | 78.95 | 75.45 | 68.20 | |||||
Year-low (in CHF per share) | 25.32 | 29.50 | 60.10 | 41.15 | 45.55 | |||||
Price at 31.12. | 39.26 | 33.08 | 65.90 | 75.25 | 51.10 | |||||
Annual performance in % | 18.7 % | (49.8 %) | (12.4 %) | 47.3 % | (11.5 %) | |||||
Average number of shares | 99,524 | 53,506 | 39,775 | 34,010 | 46,814 | |||||
Stock market capitalisation at 31.12. | 725,210 | 611,054 | 1,217,305 | 1,390,018 | 943,919 |
Source: Bloomberg
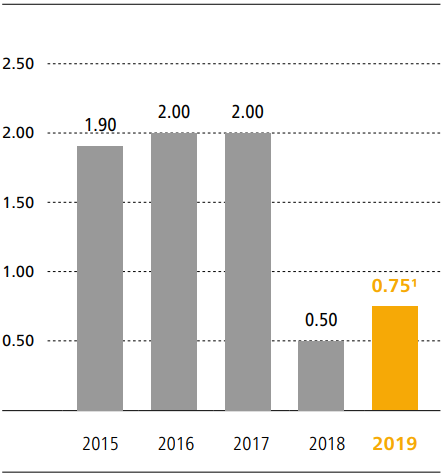
Cash dividend
in CHF per share
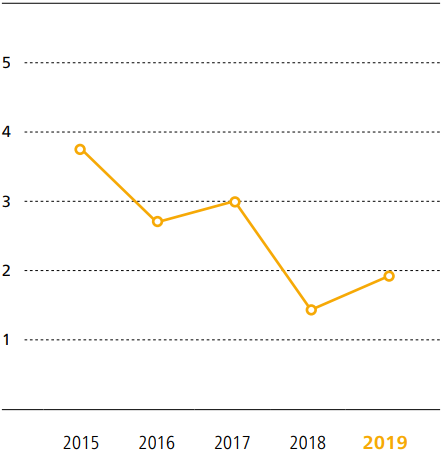
Dividend yield
in %
Dividend policy and returns
Position of strength
The Board of Directors is asking the General Meeting of Shareholders of 24 March 2020 to approve an ordinary dividend of CHF 0.75 per share for the 2019 financial year. The proposed total dividend payout for 2019 is CHF 13.9 million. This means that Implenia will have made almost CHF 287 million in overall dividend payments since its IPO in 2006.
Key data
Ticker symbol | IMPN | |
Security number | 2 386 855 | |
ISIN | CH002 386 8554 |
Share capital | ||||||||||
31.12.2019 | 31.12.2018 | 31.12.2017 | 31.12.2016 | 31.12.2015 | ||||||
Share capital (in TCHF) | 18,841 | 18,841 | 18,841 | 18,841 | 18,841 | |||||
Number of registered | 18,472,000 | 18,472,000 | 18,472,000 | 18,472,000 | 18,472,000 | |||||
Of which treasury shares | 13,851 | 67,054 | 210,223 | 94,042 | 163,105 | |||||
Number of outstanding | 18,458,149 | 18,404,946 | 18,261,777 | 18,377,958 | 18,308,895 | |||||
Par value of each | 1.02 | 1.02 | 1.02 | 1.02 | 1.02 | |||||
Conditional / Authorised capital | 3,768 | 3,768 | 3,768 | 4,710 | 4,710 |
Key figures | ||||||||||
31.12.2019 | 31.12.2018 | 31.12.2017 | 31.12.2016 | 31.12.2015 | ||||||
Earnings per share, undiluted (in CHF) | 1.61 | (0.28) | 1.95 | 3.27 | 2.64 | |||||
Price-earnings ratio | 24.4 | (118.1) | 33.8 | 23.0 | 19.4 | |||||
Equity per share (in CHF) | 30.48 | 30.44 | 34.67 | 35.08 | 33.07 | |||||
Gross dividend1 (in CHF) | 0.75 | 0.50 | 2.00 | 2.00 | 1.90 | |||||
Dividend yield | 1.9 % | 1.5 % | 3.0 % | 2.7 % | 3.7 % | |||||
Distribution ratio2 | 46.7 % | n.a. | 102.1 % | 61.4 % | 71.9 % |
1 2015 CHF 1.80 ordinary dividend, CHF 0.10 one-off anniversary dividend
2019: Plus dividend in kind from the Ina invest transaction of max. CHF 1.20 per share; subject of approval by the AGM.
2 Based on number of outstanding shares at 31.12.
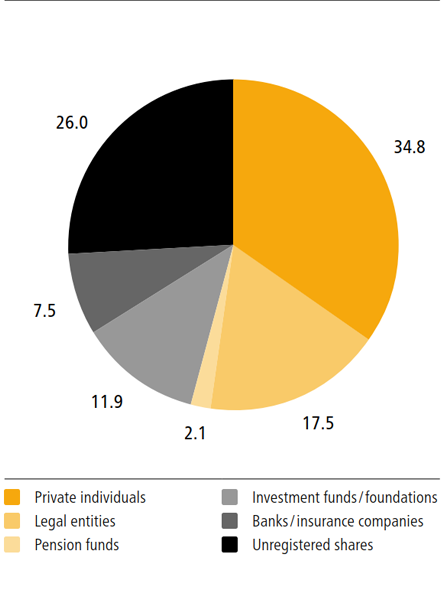
Share capital by type of shareholder
(shares with and without voting rights) in %
Shareholders by size of shareholding
(shares with and without voting rights) in %
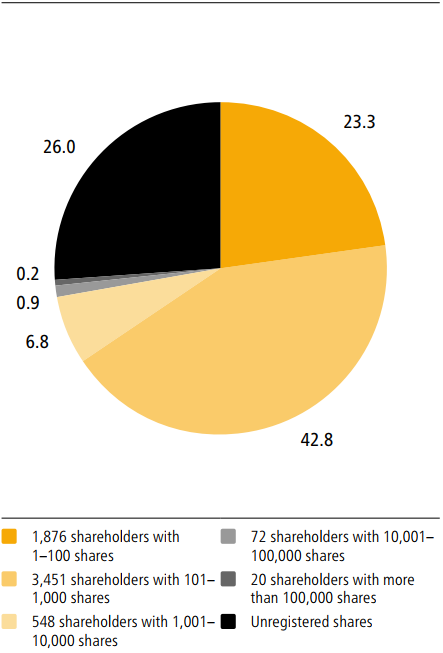
Shareholder structure
Major shareholders / nominees owning more than 3 % of share capital | ||||
Name | Number of shares | Percentage of | ||
Parmino Holding AG / Max Rössler | 3,048,970 | 16.5 % | ||
Rudolf Maag | 1,000,000 | 5.4 % | ||
Credit Suisse Funds AG | 932,675 | 5.1 % | ||
Norbert Ketterer | 930,000 | 5.0 % | ||
Chase Nominees Ltd. | 596,592 | 3.2 % | ||
Dimensional Holdings Inc. | 555,019 | 3.0 % | ||
Analyst recommendations
Coverage of Implenia’s shares
Investment specialists continuously analyse Implenia’s business performance, results and market situation. Five analysts regularly publish studies on Implenia shares.
Broker / bank | Rating | |
Bank Vontobel | Hold | |
HSBC | Hold | |
Kepler Cheuvreux | Buy | |
Research Partners | Buy | |
Zürcher Kantonalbank | Outperform | |
Status: 29.1.2020 | ||
Credit ratings
Implenia Ltd. has no official credit rating from a credit rating agency. The listed ratings are based on each bank’s internal criteria. Please note that credit ratings can change at any time.
Rating agency / bank | Rating | Outlook | ||
Credit Suisse | Low BBB | stable | ||
UBS | BBB‑ | stable | ||
Zürcher Kantonalbank | BBB‑ | negative | ||
Fedafin | Baa‑ | negative | ||
Status: 29.1.2020 | ||||
Bonds/promissory note loans
Outstanding bonds
Implenia Ltd. has issued the following CHF bonds and listed them on the SIX Swiss Exchange.
Coupon | Term | Nominal | Issue price | Due | ISIN code | |||||
1.625 % | 2014 ‑ 2024 | CHF 125 million | 101.06 % | 15.10.2024 | CH0253592767 | |||||
0.500 % | 2015 ‑ 2022 | CHF 175 million | 100.00 % | 30.6.2022 | CH0285509359 | |||||
1.000 % | 2016 ‑ 2026 | CHF 125 million | 100.74 % | 20.3.2026 | CH0316994661 |
The CHF 175 million issue (0.500% coupon) is a subordinated convertible bond, which has an unchanged conversion price of CHF 75.06. The convertible bond will be convertible into 2.3 million registered shares of Implenia Ltd., which is equivalent to around 12.6% of outstanding registered shares. The shares to be delivered as a result of conversion will be made available by providing new shares from conditional capital.
Outstanding promissory note loans
In June 2017, Implenia issued a promissory note loan (private placement), for a total amount of EUR 60 million. The three EUR tranches have fixed interest rates and maturities of four, six and eight years.
Coupon | Term | Nominal | Due | |||
Fixed | 2017 ‑ 2021 | EUR 10 million | 9.6.2021 | |||
Fixed | 2017 ‑ 2023 | EUR 20 million | 9.6.2023 | |||
Fixed | 2017 ‑ 2025 | EUR 30 million | 9.6.2025 |
Overview of key figures
Five-year Implenia Group overview | ||||||||||
in TCHF | 2019 | 2018 | 2017 | 2016 | 2015 | |||||
Order book (as at 31.12.) | 6,157,507 | 6,248,291 | 6,043,261 | 5,171,795 | 5,133,513 | |||||
Income statement | ||||||||||
Production output | 4,517,550 | 4,452,761 | 3,926,727 | 3,320,418 | 3,430,459 | |||||
Consolidated revenue | 4,430,833 | 4,364,473 | 3,859,478 | 3,266,986 | 3,288,200 | |||||
EBITDA | 186,768 | 89,726 | 173,835 | 166,184 | 161,360 | |||||
Depreciation and amortisation | (123,261) | (76,791) | (110,244) | (68,277) | (81,424) | |||||
Operating income | 63,507 | 12,935 | 63,591 | 97,907 | 79,936 | |||||
Consolidated profit | 33,920 | 504 | 39,033 | 64,453 | 52,018 | |||||
Cash flow statement | ||||||||||
Cash flow from operating activities | 143,549 | 16,052 | 197,345 | 62,429 | 145,194 | |||||
Cash flow from investment activities | (58,678) | (68,638) | (34,810) | (34,487) | (129,016) | |||||
Cash flow from financing activities | (79,732) | (14,872) | 23,112 | (114,573) | 136,119 | |||||
Free cash flow | 84,871 | (52,586) | 162,535 | 27,942 | 16,178 | |||||
Investment activities | ||||||||||
Investments in real estate transactions | 53,170 | 62,821 | 39,802 | 49,016 | 65,381 | |||||
Real estate disposals | (48,951) | (35,584) | (67,378) | (59,472) | (98,648) | |||||
Investments in fixed assets | 70,635 | 80,025 | 70,050 | 61,243 | 58,843 | |||||
in TCHF | 31.12.2019 | 31.12.2018 | 31.12.2017 | 31.12.2016 | 31.12.2015 | |||||
Balance sheet | ||||||||||
Cash and cash equivalents | 912,317 | 913,233 | 985,443 | 791,703 | 877,108 | |||||
Real estate transactions | 189,486 | 185,292 | 158,055 | 185,631 | 196,087 | |||||
Other current assets | 1,124,833 | 1,044,098 | 1,043,616 | 1,087,291 | 1,068,281 | |||||
Non-current assets | 856,627 | 718,732 | 709,880 | 564,552 | 589,190 | |||||
Total assets | 3,083,263 | 2,861,355 | 2,896,994 | 2,629,177 | 2,730,666 | |||||
Financial liabilities | 639,753 | 516,022 | 496,930 | 415,406 | 489,002 | |||||
Other liabilities | 1,853,041 | 1,760,158 | 1,745,155 | 1,548,265 | 1,617,888 | |||||
Equity | 590,469 | 585,175 | 654,909 | 665,506 | 623,776 | |||||
Total equity and liabilities | 3,083,263 | 2,861,355 | 2,896,994 | 2,629,177 | 2,730,666 | |||||
Net cash position excl. lease liabilities | 420,500 | 405,540 | 495,270 | 381,035 | 392,804 | |||||
Capital structure | ||||||||||
Equity ratio in % | 19.2 | 20.5 | 22.6 | 25.3 | 22.8 | |||||
Equity ratio in %1 | 24.6 | 26.2 | 28.2 | 31.4 | 28.6 | |||||
Long-term liabilities in % | 22.6 | 21.1 | 21.6 | 19.9 | 16.1 | |||||
Short-term liabilities in % | 58.2 | 58.4 | 55.8 | 54.8 | 61.1 | |||||
Employees (FTE; as at 31.12.)2 | 8,867 | 8,765 | 8,391 | 7,388 | 7,445 |
1 Incl. sobordinated convertible bond
2 Excl. temporary staff
in % | 2019 | 2018 | 2017 | 2016 | 2015 | |||||
Key figures | ||||||||||
EBITDA margin in %1 | 4.2 | 2.1 | 4.5 | 5.1 | 4.9 | |||||
Operating income margin in %1 | 1.4 | 0.3 | 1.6 | 3.0 | 2.4 | |||||
Return on Invested Capital (ROIC) in % | 32.5 | 6.8 | 26.8 | 34.5 | 32.1 |
1 Basis: consolidated revenue
Sustainable investment
Increasing value through sustainability
Sustainability is an integral component of our business and our value system. This makes Implenia’s shares and bonds attractive to investors who take a socially responsible approach to investment.
Global Compact
Implenia is certified under the ISO 14000 standard – Environmental Management – and has pursued its own sustainability strategy since 2009. Our sustainability reporting is based on the Global Reporting Initiative (GRI).
Our commitment has been recognised in a series of external ratings. We are one of the leading construction companies for sustainability. Implenia received an AA rating from MSCI ESG (2019) and is covered by sustainability research units at various Swiss banks.

Bank coverage | Sustainability rating | |
J. Safra Sarasin | Above average | |
Zürcher Kantonalbank | A |
Pioneer of “green” credit financing
The world’s leading provider of research and ratings on environmental, social and governance (ESG) issues, most recently awarded Implenia an outstanding 79 points. This was a further improvement on the previous year’s rating. It makes Implenia an industry leader, as well as a pioneer of “green” credit financing. Implenia is the first industrial company in Switzerland to have a syndicated loan partially linked to its Sustainalytics rating. Thanks to its current good rating, Implenia enjoys better borrowing conditions.
The fact that Implenia’s many years of sustainability work are having a clear monetary impact on its funding situation marks a very important milestone.
Communication, contacts, dates
Communications
Implenia follows an open, transparent and timely information policy in the interests of its shareholders, investors and the general public. In its periodic and its ad hoc reporting, Implenia is committed to equal treatment of all stakeholder groups with regard to timing and content. Comprehensive information is available to all investors, journalists and interested members of the public at www.implenia.com under the “Investors” link. All the latest investor presentations are also available at this address.
Interested parties can subscribe to our ad hoc communications by clicking through to the “Media/News Service” page on the site. As in previous years, in 2019 the CEO, CFO and Head of Investor Relations presented the company to institutional investors at roadshows, conferences and meetings, as well as at a Capital Market Day. In 2019 Implenia held its two customary conferences on the financial results – half-year and full-year – for analysts and the media.
Contacts
For ongoing communication with shareholders, investors, journalists and analysts:
Christian Dubs
Head of Investor Relations
T +41 58 474 29 99
Silvan Merki
Chief Communication Officer
T +41 58 474 74 77
Dates | ||
2020 Annual General Meeting | 24.3.2020 | |
Ex-date (dividend distribution) | 30.3.20201 | |
Record date (dividend distribution) | 31.3.20201 | |
Payment date (dividend distribution) | 1.4.20201 | |
Media and analysts' conference on the 2020 first-half results | 19.8.2020 |
1 Dates subject to approval of dividend distribution by AGM.
