Group profile
Implenia meets expectations in transition year 2019
Implenia has met expectations with its results for the 2019 financial year. The internationally active Swiss construction services provider achieved EBITDA of CHF 186.8 million after strategy implementation costs of around CHF 20 million. Implenia is executing its new strategy rigorously and successfully. The operating model and new organisational structure have been bedded in quickly and are having a positive impact. Significant progress has been made on the implementation of strategic priorities in all areas.
Consolidated key figures | ||||||||
in TCHF | 2019 | 2018 | Δ | Δ like for like1 | ||||
Consolidated revenue | 4,430,833 | 4,364,473 | 1.5 % | 3.6 % | ||||
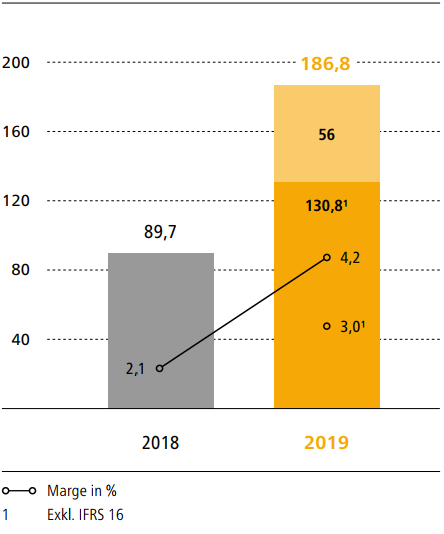
EBITDA excl. IFRS 16 | 130,782 | 89,726 | 45.8 % | 45.7 % | ||||
in % of consolidated revenue | 3.0 % | 2.1 % | ||||||
EBITDA | 186,768 | 89,726 | ||||||
in % of consolidated revenue | 4.2 % | 2.1 % | ||||||
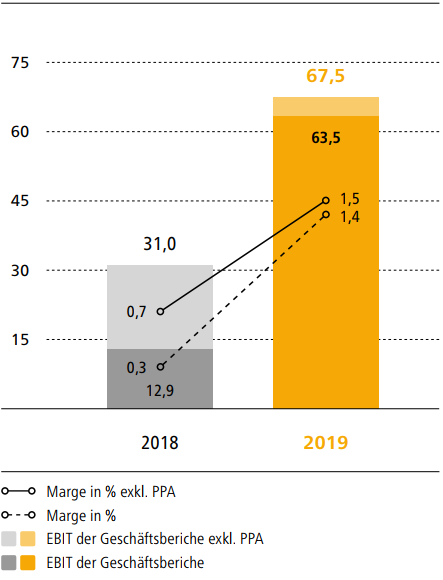
Operating income | 63,507 | 12,935 | ||||||
Consolidated profit | 33,920 | 504 | ||||||
Free cash flow | 84,871 | (52,586) | ||||||
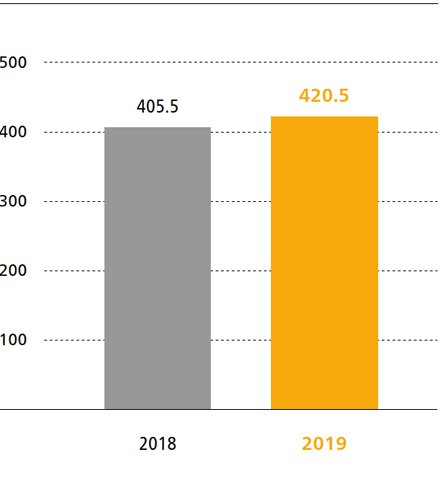
Net cash position excl. lease liabilities (as at 31.12.) | 420,500 | 405,540 | 3.7 % | 6.0 % | ||||
Net cash position (as at 31.12.) | 272,564 | 397,211 | ||||||
Equity (as at 31.12.) | 590,469 | 585,175 | 0.9 % | 2.3 % | ||||
Order book (as at 31.12.) | 6,157,507 | 6,248,291 | (1.5 %) | 0.9 % | ||||
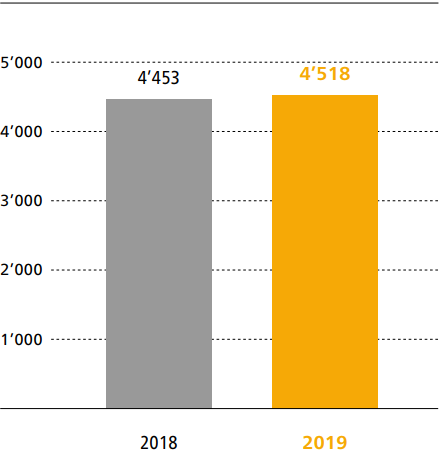
Production output | 4,517,550 | 4,452,761 | 1.5 % | 3.5 % | ||||
Employees (FTE; as at 31.12.) | 8,867 | 8,765 | 1.2 % |
1 Foreign currency adjusted
Implenia Executive Committee
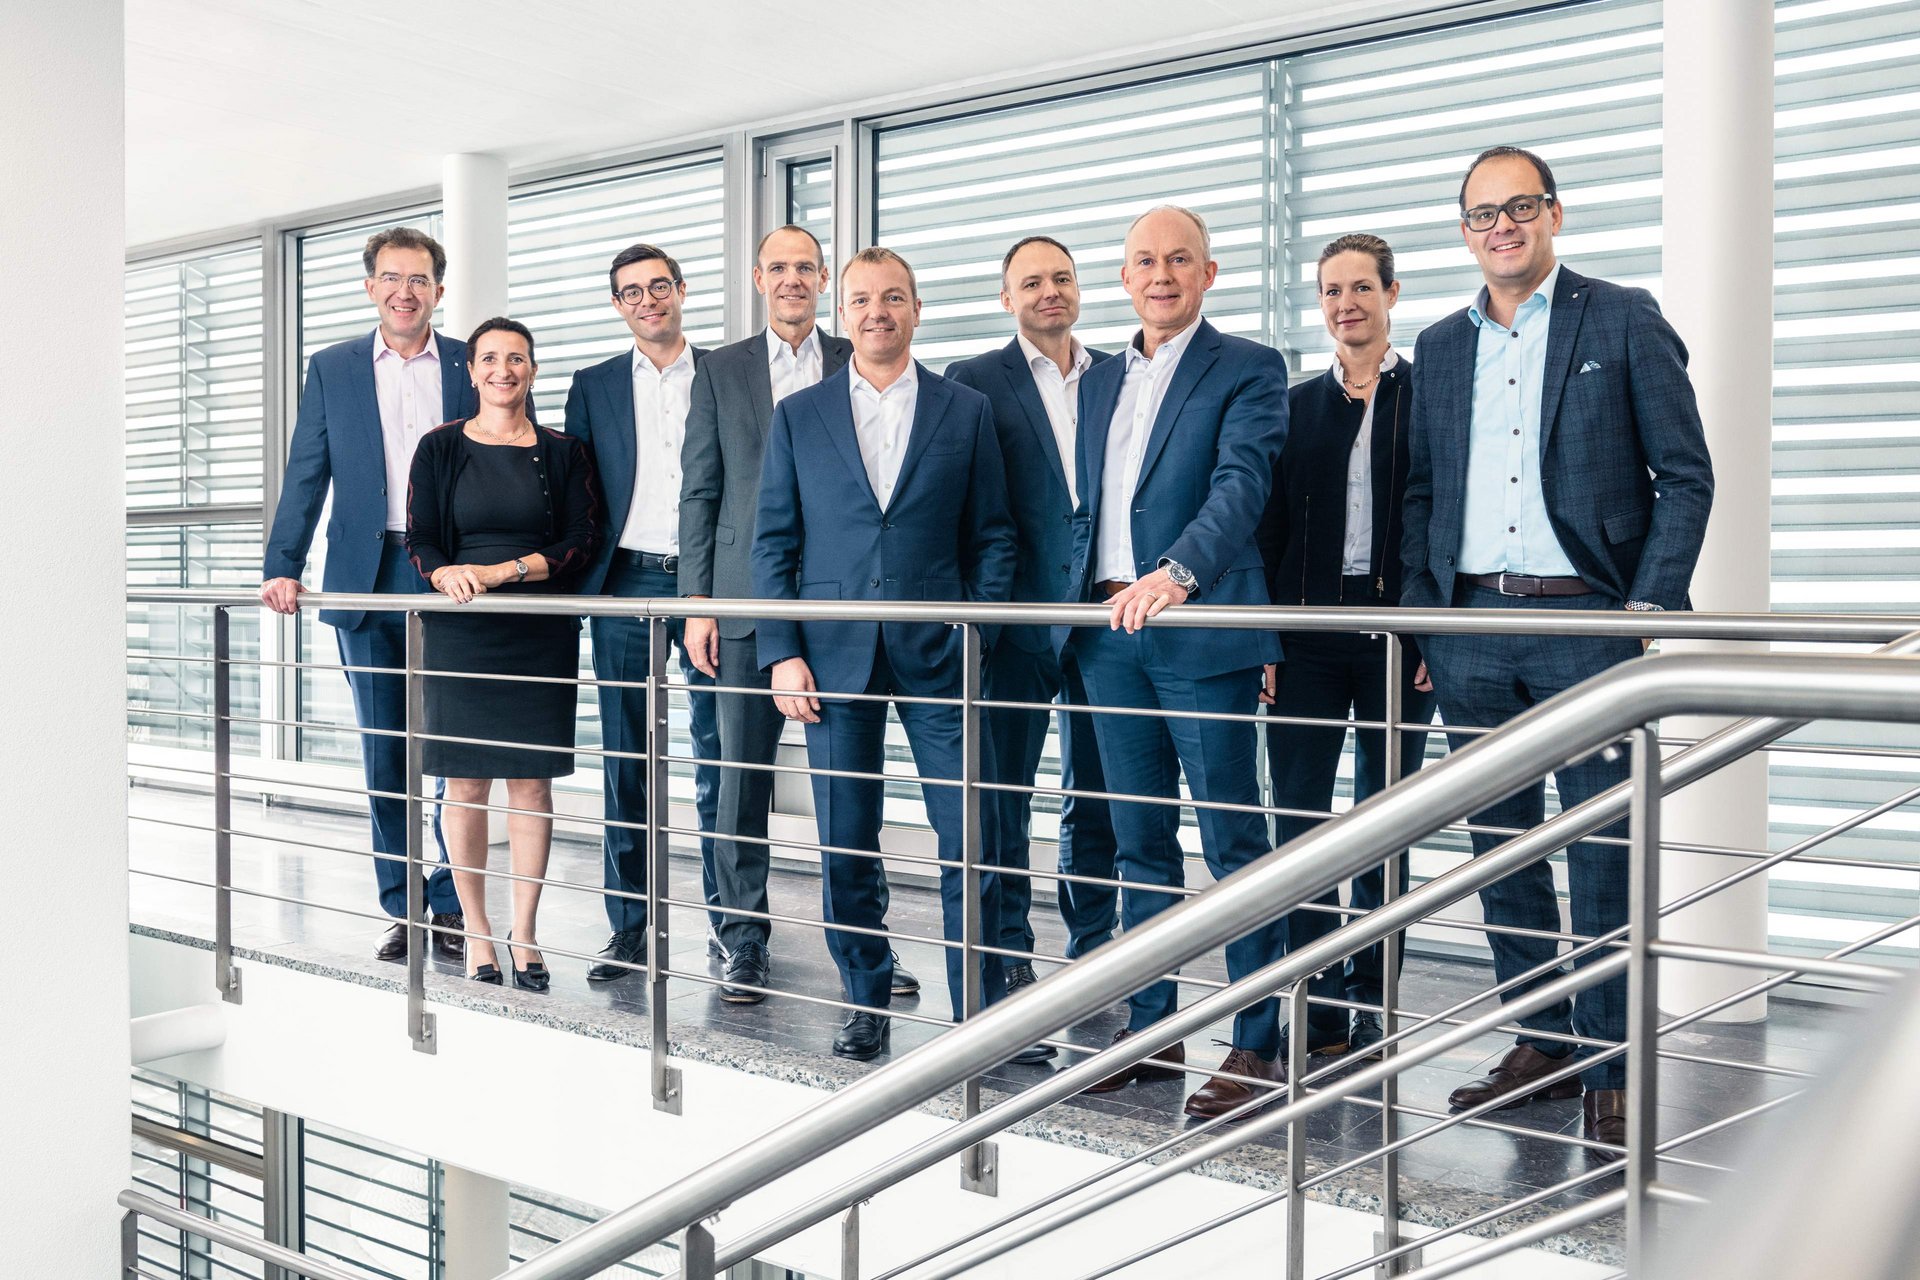
From left to right:
Christian Späth (Head Division Civil Engineering), Christelle Beneteau (Chief Human Resources Officer), Jens Vollmar (Head Division Buildings und Country President Switzerland), Marco Dirren (Chief Financial Officer), André Wyss (Chief Executive Officer), German Grüniger (General Counsel), Matthias Jacob (Head Country Management und Country President Germany), Anita Eckardt (Head Division Specialties), Adrian Wyss (Head Division Development)
Key balance sheet figures | ||||||
in TCHF | 31.12.2019 | 31.12.2018 | Δ | |||
Cash and cash equivalents | 912,317 | 913,233 | (0.1 %) | |||
Real estate transactions | 189,486 | 185,292 | 2.3 % | |||
Other current assets | 1,124,833 | 1,044,098 | 7.7 % | |||
Non-current assets | 856,627 | 718,732 | 19.2 % | |||
Total assets | 3,083,263 | 2,861,355 | 7.8 % | |||
Financial liabilities | 639,753 | 516,022 | 24.0 % | |||
Other liabilities | 1,853,041 | 1,760,158 | 5.3 % | |||
Equity | 590,469 | 585,175 | 0.9 % | |||
Total equity and liabilities | 3,083,263 | 2,861,355 | 7.8 % | |||
Net cash position excl. lease liabilities | 420,500 | 405,540 | 3.7 % | |||
Investments in real estate transactions | 53,170 | 62,821 | (15.4 %) | |||
Investments in fixed assets | 70,635 | 80,025 | (11.7 %) | |||
Equity ratio | 19.2 % | 20.5 % |
Revenue and EBIT both up
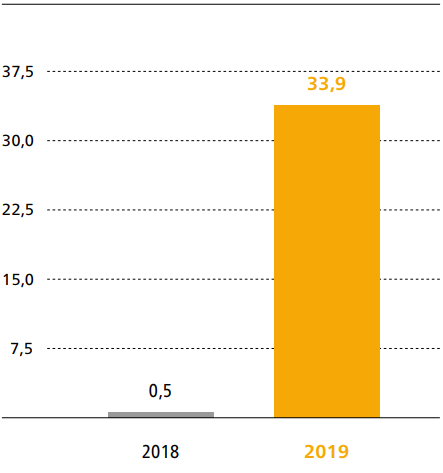
Implenia generated revenue of CHF 4,431 million in 2019 (2018: CHF 4,364 million), an increase of around 1.5% on the previous year. After adjusting for currency movements, revenue growth was 3.6%. As expected, the Group achieved EBITDA of CHF 186.8 million (excl. IFRS 16: CHF 130.8 million), up from the prior year’s CHF 89.7 million. A total of around CHF 20 million was spent on strategy implementation. This spending was concentrated mainly on Value Assurance, supplier consolidation and contract renegotiation, the ERP transformation project INSPIRE and implementation of the operating model and new organisational structure. Group operating income (excl. PPA) met expectations at CHF 67.6 million (2018: CHF 31.0 million). Consolidated profit was CHF 33.9 million (2018: CHF 0.5 million).
Much higher operating cash flow
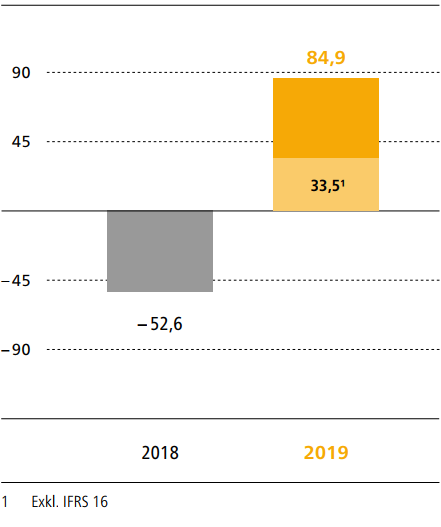
Implenia delivered a solid operating cash flow and was able to finance all investments from its own business. Incoming payments from key projects helped to improve operating cash flow from CHF 16.1 million in the previous year to CHF 143.5 million (excl. IFRS 16: CHF 92.3 million). Free cash flow came to CHF 84.9 million (excl. IFRS 16: CHF 33.5 million; 2018: –52.6 million).
Balance sheet remains robust
Implenia’s balance sheet remains robust. Cash and cash equivalents remained around the same level as the prior year at CHF 912.3 million (2018: CHF 913.2 million). Total assets at end-2019 came to CHF 3,083 million (2018: CHF 2,861 million). The increase is primarily due to the first-time application of IFRS 16. Equity rose over the year from CHF 585.2 million to CHF 590.5 million. As a result, the equity ratio is basically unchanged at 19.2% (19.8% excl. currency and pension impact). The Group still has a solid equity base by industry standards, and Implenia is confident that this will continue. Confidence is fuelled by the completion of PPA amortisation and the expected positive contributions from operating business, as well as by the planned Ina Invest transaction. Implenia is unequivocally committed to maintaining its investment-grade credit rating.
All divisions post strong operating results and a positive trend
Divisions Development and Buildings achieved a very good result in 2019. Division Civil Engineering saw a continuation of the positive trend established in the first half year. Division Specialties achieved a solid EBITDA and the legacy projects in Poland were completed.
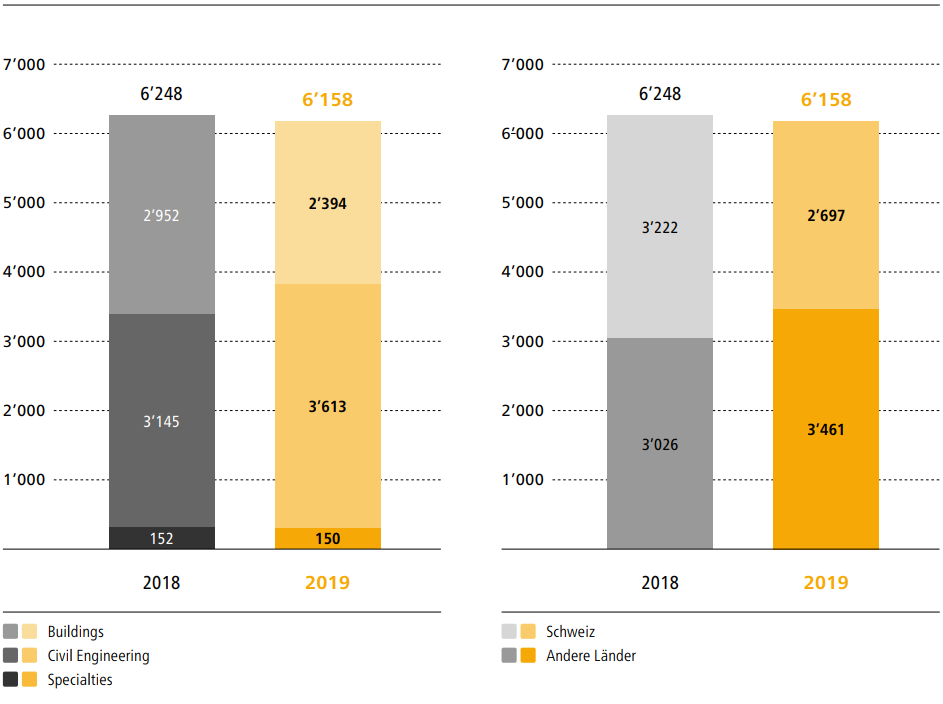
Order backlog
in CHF m
Order book | ||||||
in TCHF | 31.12.2019 | 31.12.2018 | Δ | |||
Buildings | 2,394,192 | 2,951,599 | (18.9 %) | |||
Civil Engineering | 3,612,993 | 3,144,817 | 14.9 % | |||
Specialties | 150,322 | 151,875 | (1.0 %) | |||
Total order book | 6,157,507 | 6,248,291 | (1.5 %) |
Consolidated revenue
in CHF m
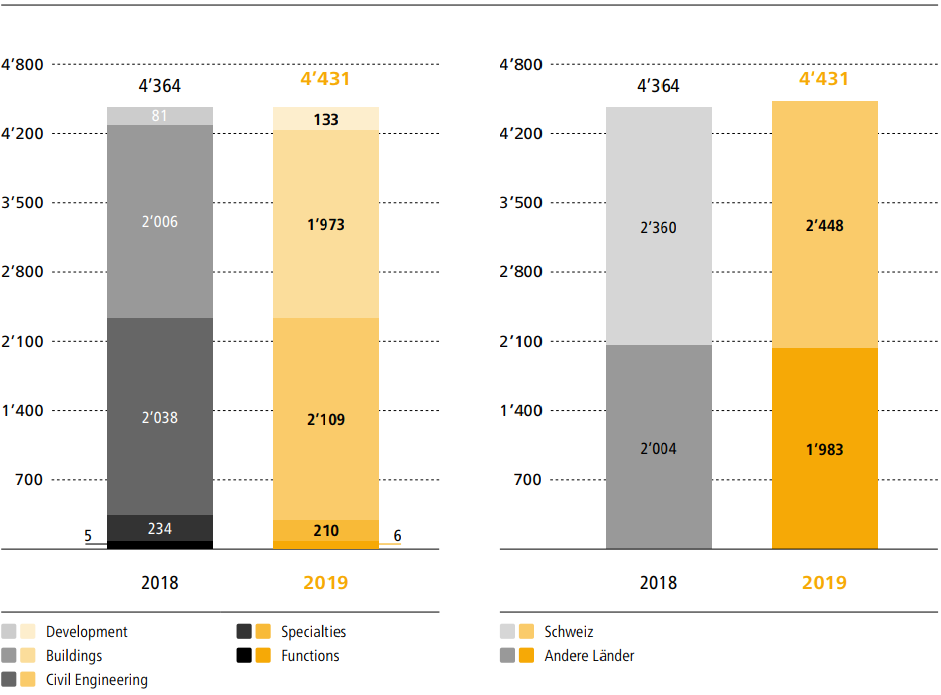
Consolidated revenue | ||||||
in TCHF | 2019 | 2018 | Δ | |||
Development | 160,419 | 107,772 | 48.9 % | |||
Buildings | 2,241,754 | 2,260,997 | (0.9 %) | |||
Civil Engineering | 2,300,218 | 2,299,551 | 0.0 % | |||
Specialties | 242,021 | 255,149 | (5.1 %) | |||
Functions / elimination of intra-group services | (513,579) | (558,996) | 8.1 % | |||
Total revenue | 4,430,833 | 4,364,473 | 1.5 % |
The Implenia Group is ready to realise its full potential
Thanks to the foundations laid over a short period of time in 2019, Implenia is ready to create sustainable added value. Implenia is growing profitably aiming for an EBITDA growth with current Group structure – before intended spin-off of part of development portfolio – for 2020 in the mid single-digit percentage before strategy implementation costs of CHF 10 million (2019: CHF 20 million).
The Group’s overall margin will be strengthened and extended through the use of digital planning and construction techniques, as well as through the Value Assurance approach and other strategic priorities. Implenia will devote its full energies to implementing its strategy and innovating, always keeping focused on its vision of becoming a leading multinational provider of construction services. The Group is now in a good position to realise its full potential. Combined with the latest market forecasts, this means that it can confirm its medium-term target EBITDA margin of 6.25% to 6.75% (incl. IFRS 16).
At the end of 2019, Implenia employed 8,867 people (full-time equivalents, excluding temporary employees), compared with 8,765 at the end of 2018.
EBITDA | ||||||
in TCHF | 2019 | 2018 | Δ1 | |||
Development | 44,474 | 40,781 | 9.1 % | |||
Buildings | 51,477 | 33,260 | 54.8 % | |||
Civil Engineering | 77,221 | 2,010 | ||||
Specialties | 19,234 | 20,137 | (4.5 %) | |||
Functions | (5,638) | (6,462) | (12.8 %) | |||
Total EBITDA | 186,768 | 89,726 | 108.2 % |
1 EBITDA is comparable with previous year if note 2 in the financial report (page 117) is taken into account
Production output
in CHF m
Operating income
in CHF m
EBITDA
in CHF m
Invested capital | ||||||
in TCHF | 31.12.2019 | 31.12.2018 | Δ | |||
Current assets (excl. cash and cash equivalents) | 1,314,319 | 1,229,390 | 6.9 % | |||
Non-current assets (excl. pension assets and rights of use from leases) | 704,437 | 713,025 | (1.2 %) | |||
Less debt capital (excl. financial liabilities and pension liabilities) | (1,830,328) | (1,739,480) | (5.2 %) | |||
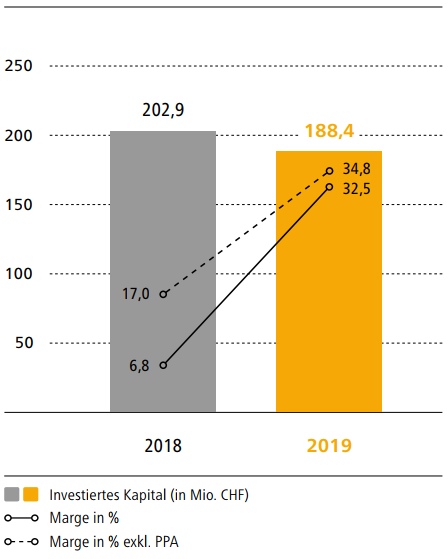
Invested capital excl. rights of use from leases | 188,428 | 202,935 | (7.1 %) | |||
Rights of use from leases | 146,491 | ‑ | ||||
Total invested capital | 334,919 | 202,935 |
Free cash flow
in CHF m
Consolidated profit
in CHF m
Return on invested capital (ROIC)
in CHF m
Net cash position, excluding liabilities
from leasing
in CHF m
