Group profile
Well positioned for success, after a chapter of significant challenge and transformation
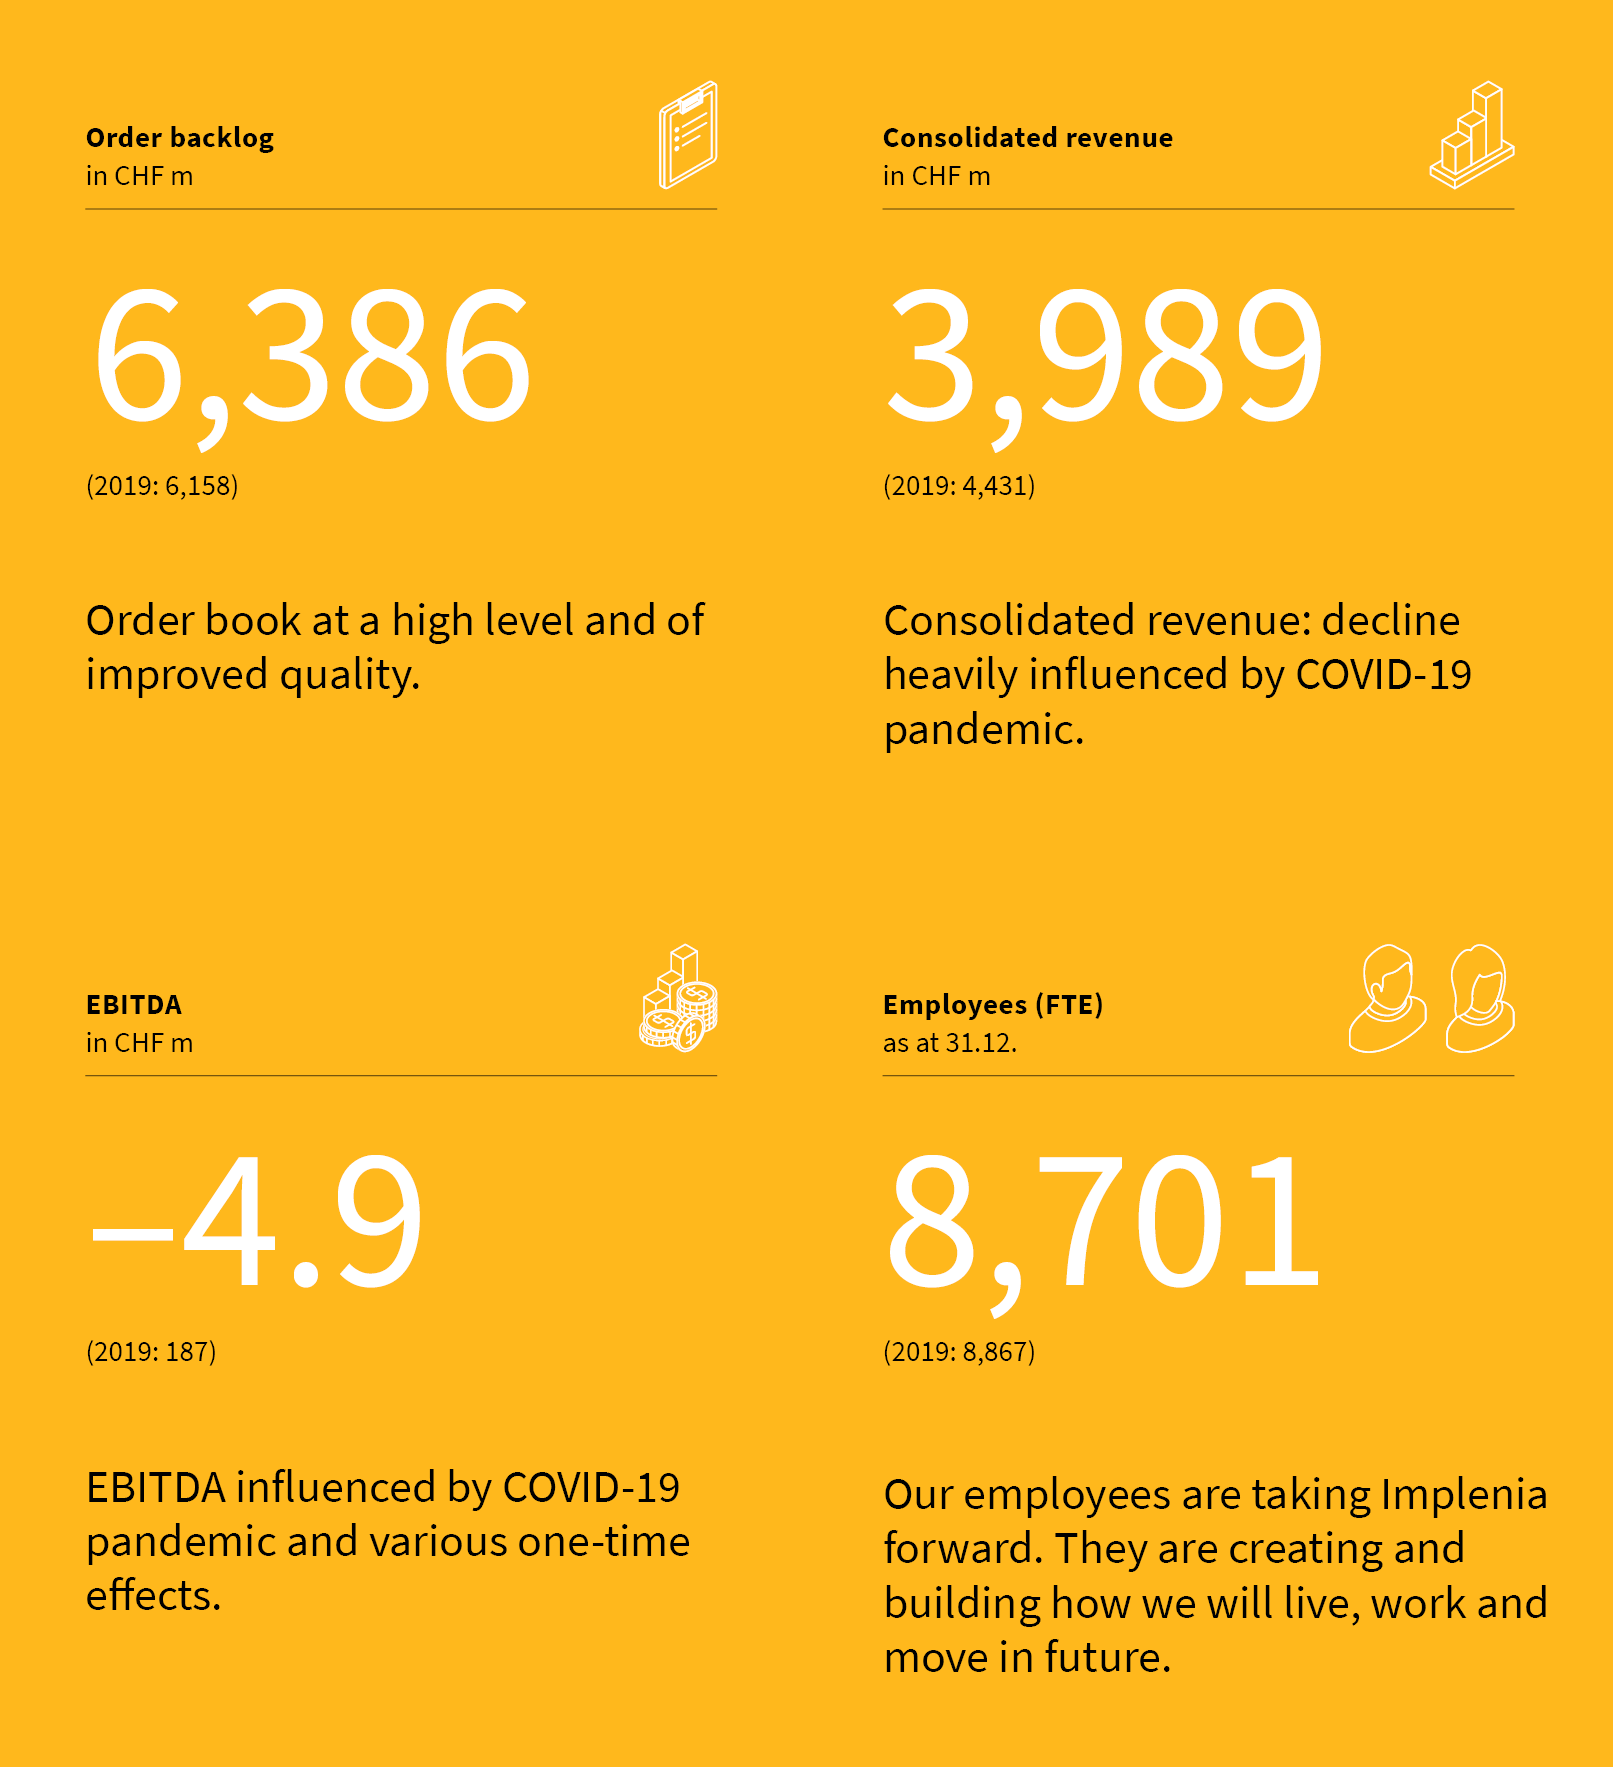
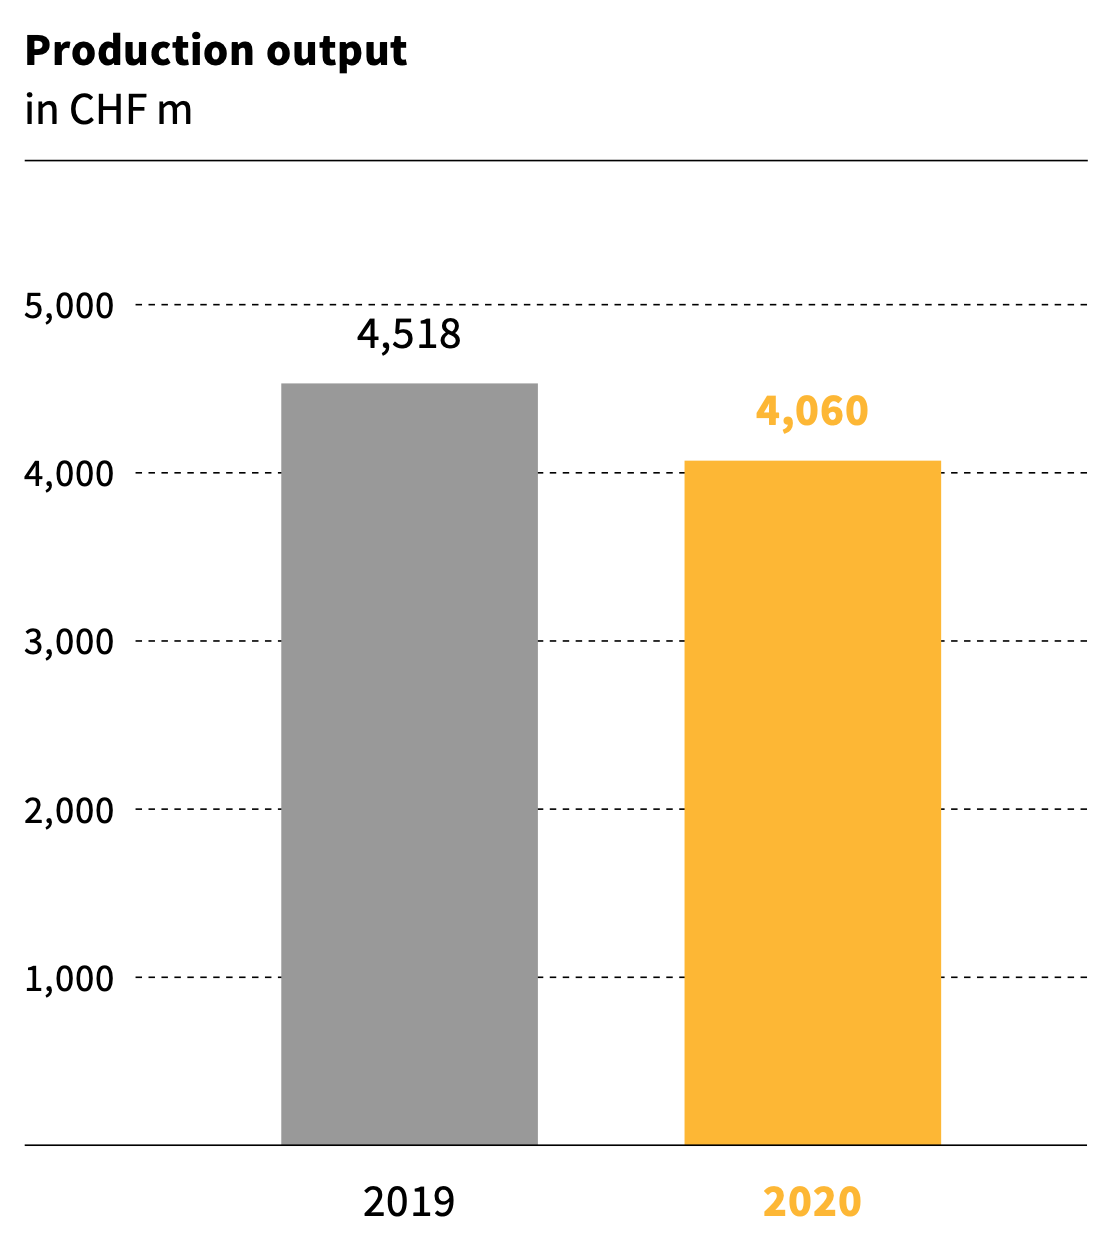
Implenia reports an EBITDA figure of CHF -4.9 million for the 2020 financial year. The intensified and accelerated strategy execution, as well as all major initiatives, are on track and having a positive impact. Implenia’s order book is high and the quality of orders has improved. The market outlook is positive despite COVID-19. Implenia is solidly financed and is confirming its medium-term EBIT target margin of 4.5%.
Consolidated key figures | ||||||||
in TCHF | 2020 | 2019 | Δ | Δ like for like1 | ||||
Consolidated revenue | 3,988,946 | 4,430,833 | (10.0 %) | (8.1 %) | ||||
EBITDA | (4,891) | 186,768 | ||||||
in % of consolidated revenue | (0.1 %) | 4.2 % | ||||||
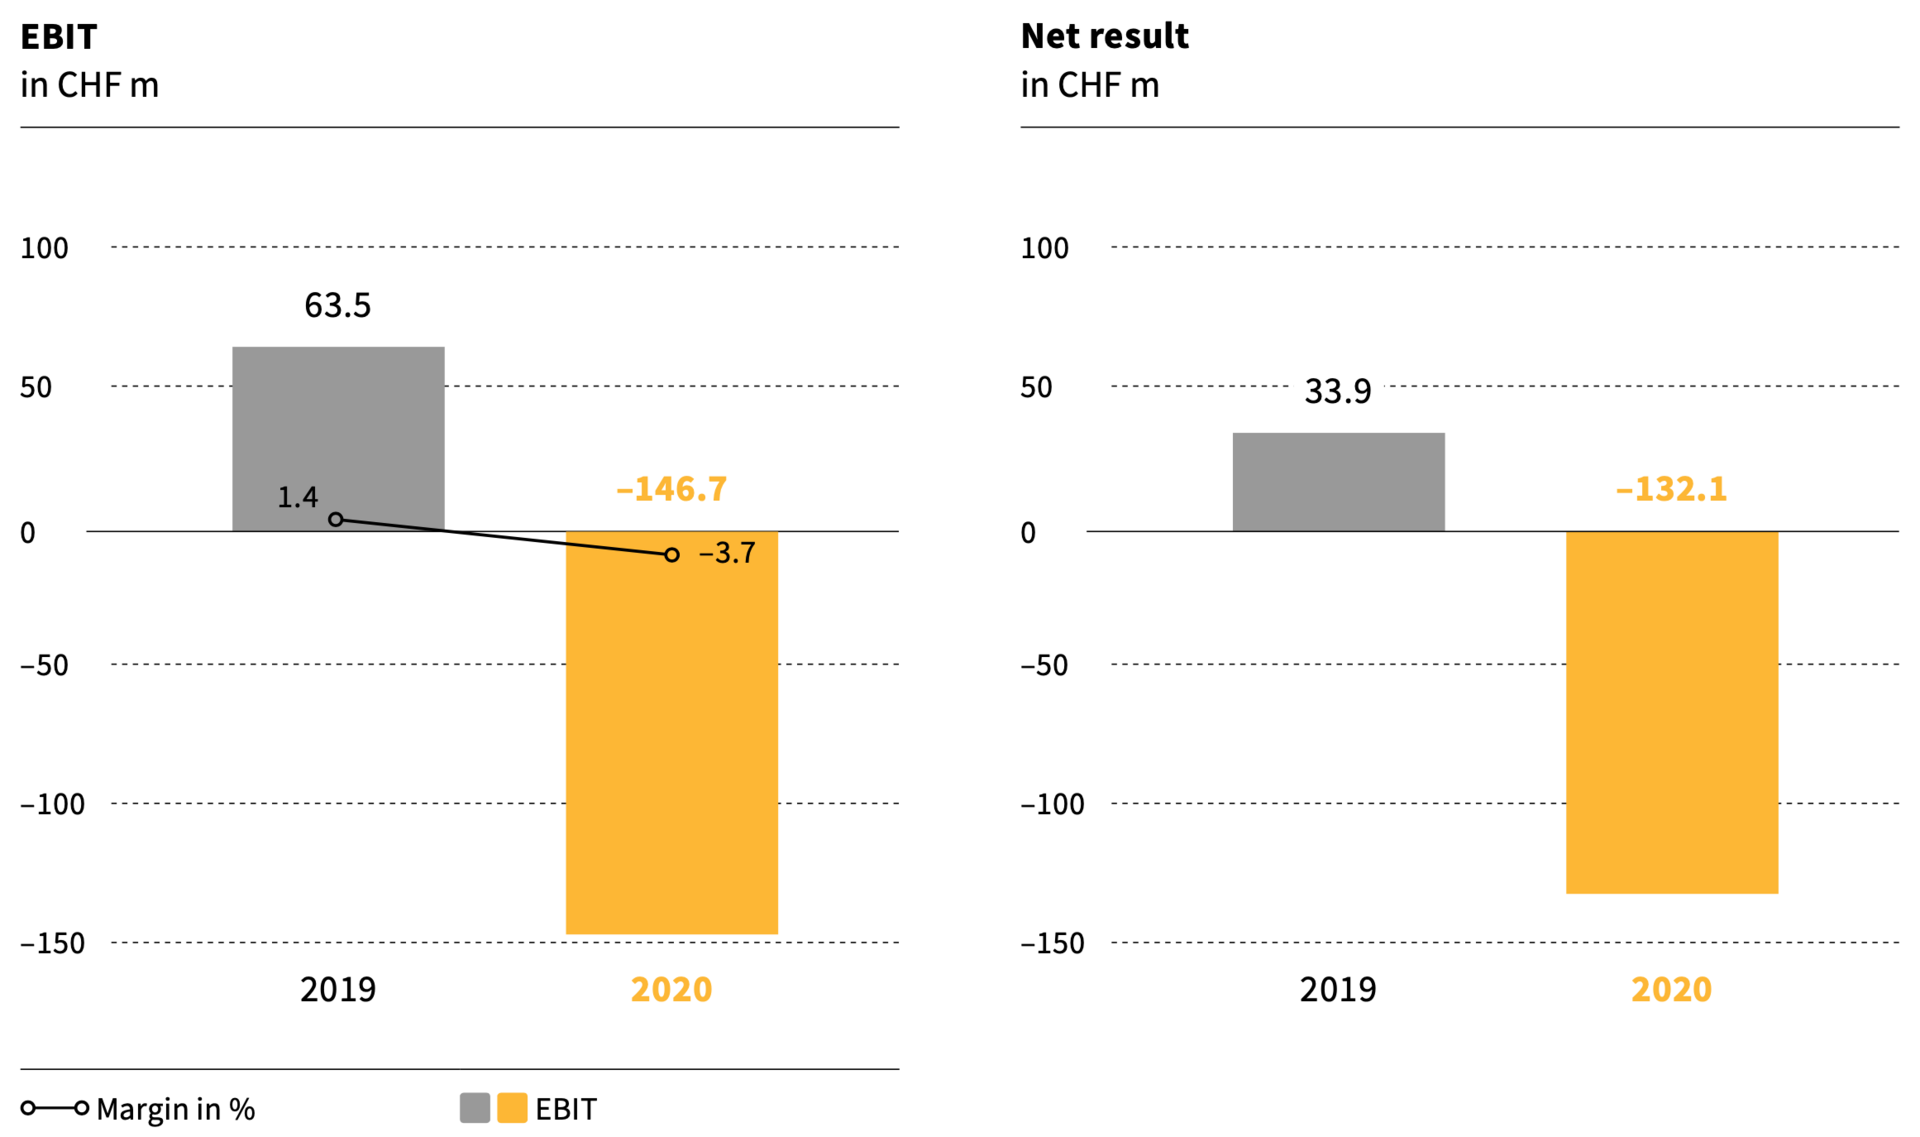
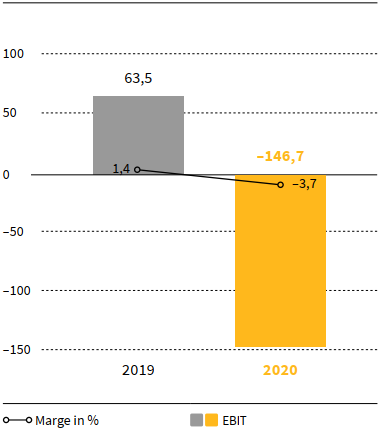
EBIT | (146,757) | 63,507 | ||||||
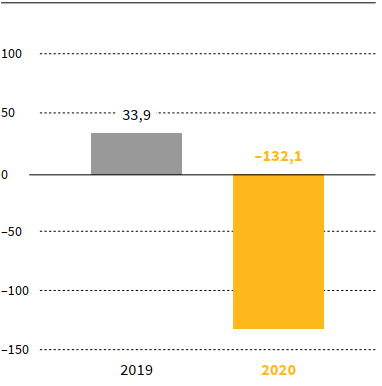
Net result | (132,052) | 33,920 | ||||||
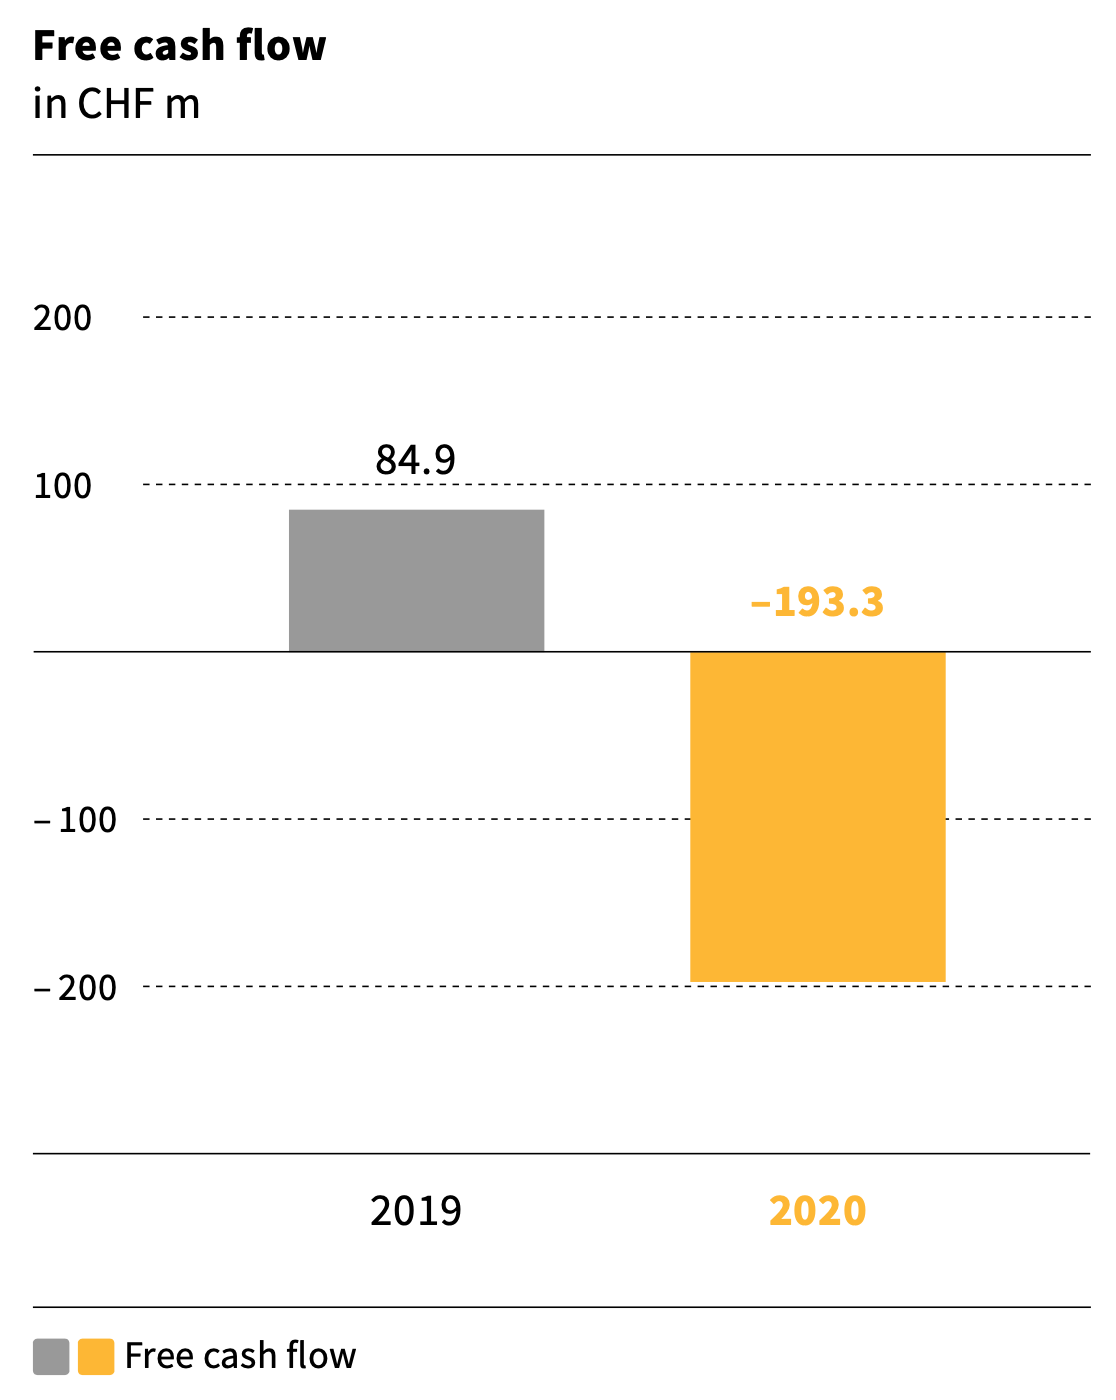
Free cash flow | (193,342) | 84,871 | ||||||
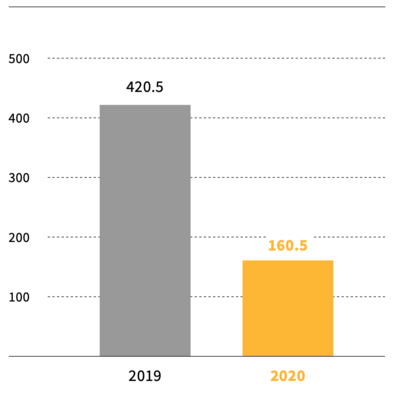
Net cash position excl. lease liabilities (as at 31.12.) | 160,526 | 420,500 | (61.8 %) | (61.3 %) | ||||
Net cash position (as at 31.12.) | (12,847) | 272,564 | ||||||
Equity (as at 31.12.) | 303,027 | 590,469 | (48.7 %) | (48.2 %) | ||||
Order book (as at 31.12.) | 6,386,284 | 6,157,507 | 3.7 % | 4.1 % | ||||
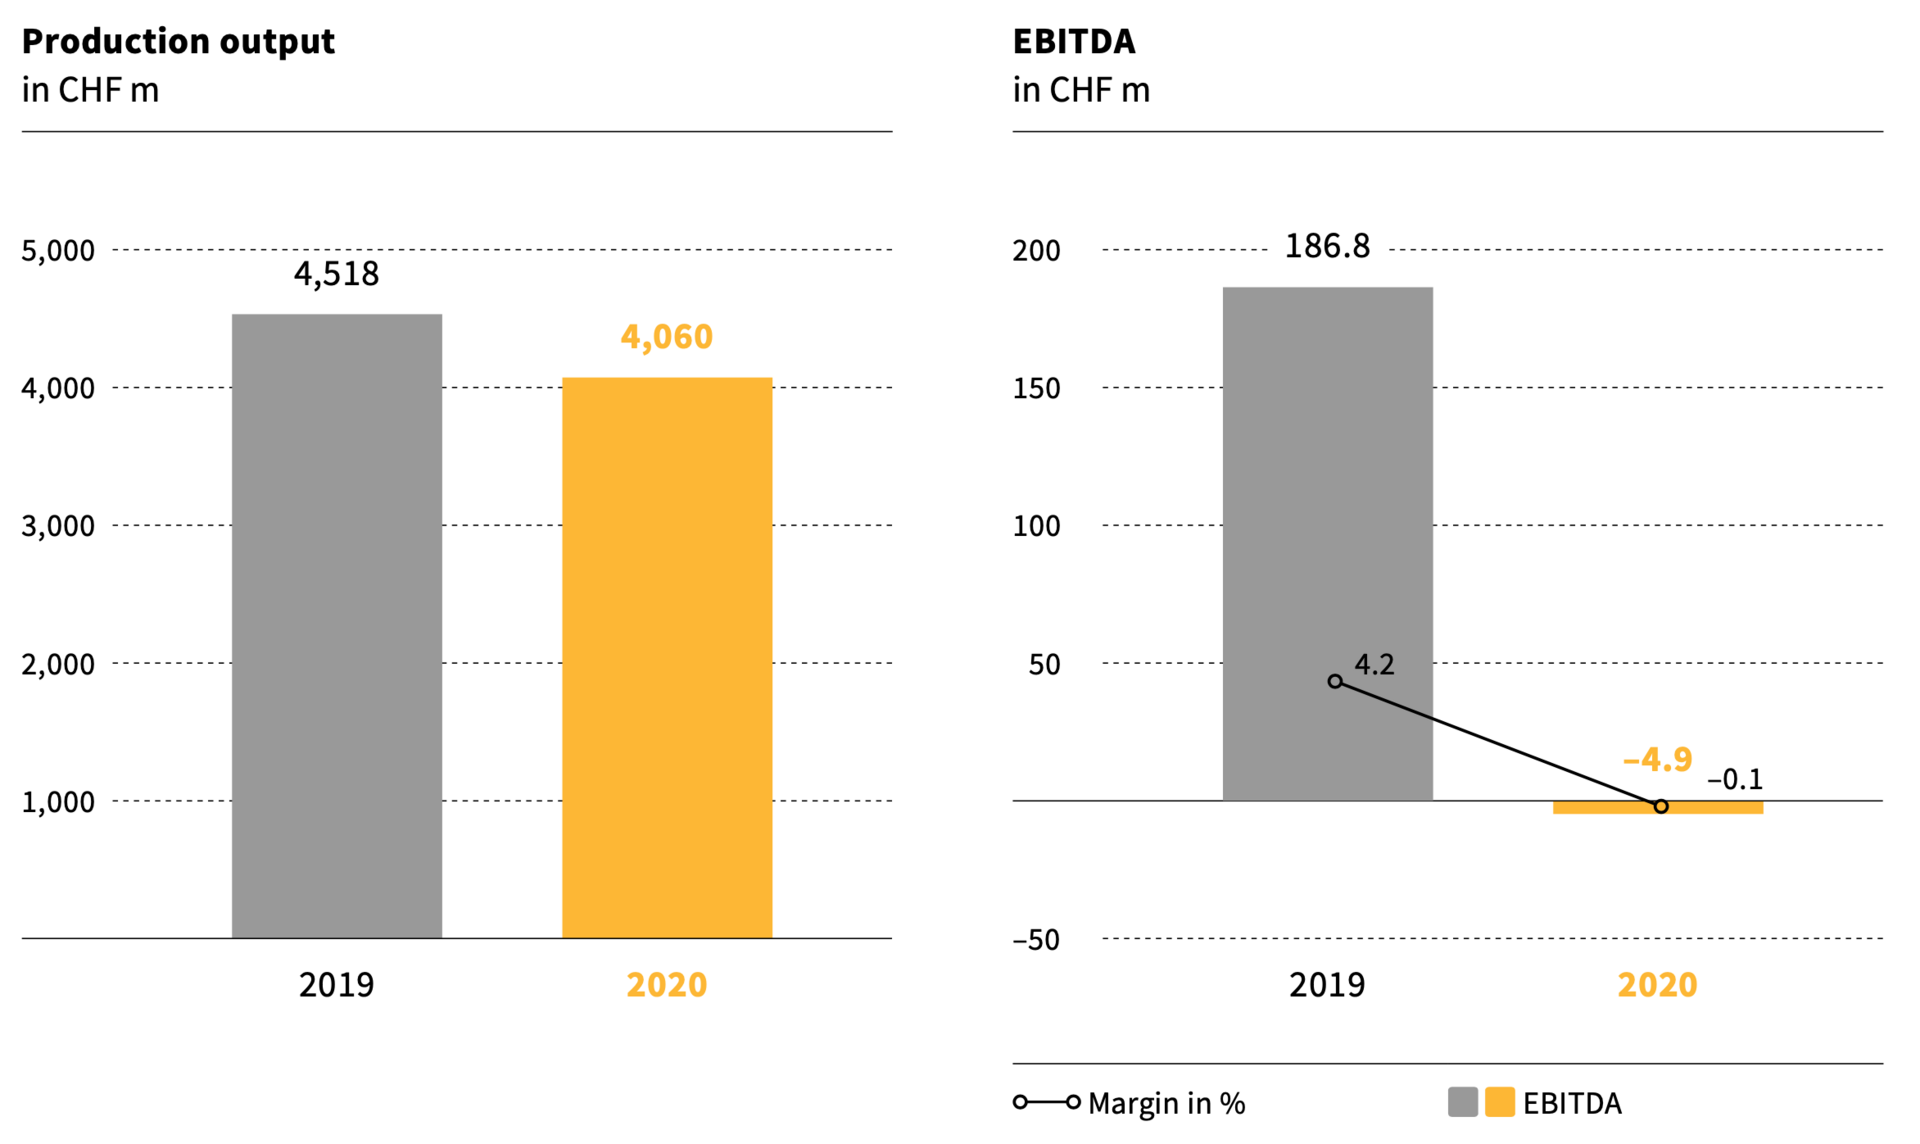
Production output | 4,060,298 | 4,517,550 | (10.1 %) | (8.1 %) | ||||
Employees (FTE; as at 31.12.) | 8,701 | 8,867 | (1.9 %) |
1 Foreign currency adjusted
Implenia Executive Committee

from left to right,
back: Claudia Bidwell (Chief Human Resources Officer), Christian Späth (Head Division Civil Engineering), Jens Vollmar (Head Division Buildings and Country President Switzerland), German Grüniger (General Counsel), Matthias Jacob (Head Country Management and Country President Germany); front: Adrian Wyss (Head Division Real Estate), André Wyss (Chief Executive Officer), Marco Dirren (Chief Financial Officer), Anita Eckardt (Head Division Specialties)
Key balance sheet figures | ||||||
in TCHF | 31.12.2020 | 31.12.2019 | Δ | |||
Cash and cash equivalents | 719,990 | 912,317 | (21.1 %) | |||
Real estate transactions | 137,130 | 189,486 | (27.6 %) | |||
Other current assets | 1,093,712 | 1,124,833 | (2.8 %) | |||
Non-current assets | 992,379 | 856,627 | 15.8 % | |||
Total assets | 2,943,211 | 3,083,263 | (4.5 %) | |||
Financial liabilities | 732,837 | 639,753 | 14.5 % | |||
Other liabilities | 1,907,347 | 1,853,041 | 2.9 % | |||
Equity | 303,027 | 590,469 | (48.7 %) | |||
Total equity and liabilities | 2,943,211 | 3,083,263 | (4.5 %) | |||
Net cash position excl. lease liabilities | 160,526 | 420,500 | (61.8 %) | |||
Investments in real estate transactions | 57,926 | 53,170 | 8.9 % | |||
Investments in fixed assets | 52,106 | 70,635 | (26.2 %) | |||
Equity ratio | 10.3 % | 19.2 % |
Solid underlying business
With its solid underlying business, Implenia generated a reported revenue of CHF 3,989 million in 2020 (2019: CHF 4,431 million). The decline of around 10% was caused mainly by COVID-19. The underlying performance at EBITDA level of CHF 163.5 million (incl. COVID-19 impact of approximately CHF -52 million) was affected by one-time effects. These include the positive impact of the Ina Invest effect, amounting to CHF 52.5 million, and further positive effects of approximately CHF 18.1 million, mainly due to lower than expected expenses for employee benefits according to IAS19. Negative impacts were caused by write-downs and re-evaluations amounting to CHF -202.6 million and restructuring provisions of CHF -36 million. This resulted in a reported EBITDA of CHF -4.9 million. EBIT came to CHF -146.8 million (2019: CHF 63.5 million), including a goodwill impairment of approximately CHF 40 million, while the net result came to CHF -132.1 million (2019: CHF 33.9 million).
Broadly diversified order book
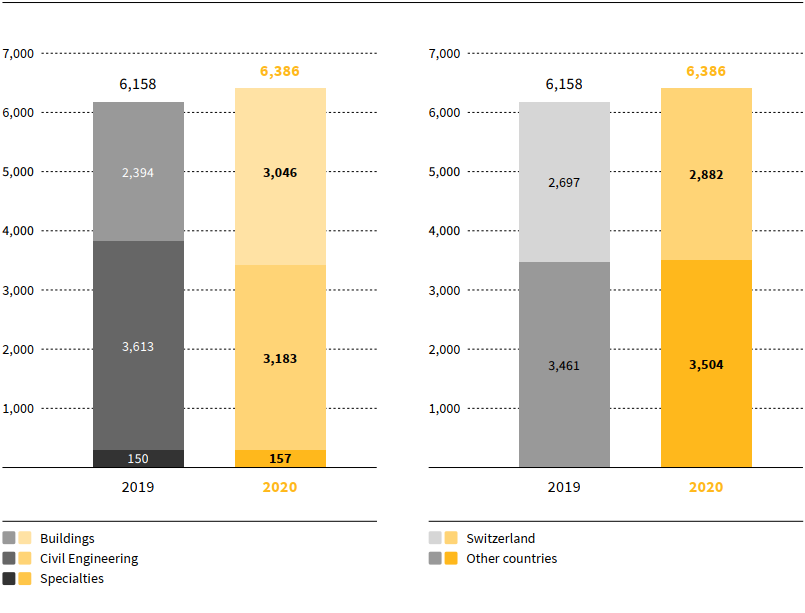
The order book reached a high level of CHF 6,386 million (2019: CHF 6,158 million) and was well diversified across all business areas and markets. Operational cash flow came to CHF -161.5 million (2019: CHF 143.5 million) and free cash flow to CHF -193.3 million (2019: 84.9 million). This was mainly due to the lower EBITDA, the increase in net working capital, continuous investments in the development portfolio and the cash-neutral Ina Invest transaction. The balance sheet remained robust with a continued high level of cash and cash equivalents – CHF 720.0 million (2019: CHF 912.3 million) – and total assets of CHF 2,943 million (2019: CHF 3,083 million respectively). The equity ratio fell temporarily to 10.3% as expected (2019: 19.2%). This was mainly caused by negative one-time effects on the result and the distribution of a dividend in kind from the Ina Invest transaction (CHF 112.4 million). The upside potential of the remaining development portfolio would result in an equity ratio well above 15%. In the medium term, the ambition is an equity ratio of over 20%.
All divisions positioned well for the future
Division Buildings, Civil Engineering and Specialties saw a year-on-year fall in EBITDA owing to one-time effects. Division Real Estate improved on its 2020 result and continued to invest in its development portfolio.
The individual performances of the four divisions are described in detail in the division chapters.
Order backlog
in CHF m
Order book | ||||||
in TCHF | 31.12.2020 | 31.12.2019 | Δ | |||
Buildings | 3,046,474 | 2,394,192 | 27.2 % | |||
Civil Engineering | 3,183,202 | 3,612,993 | (11.9 %) | |||
Specialties | 156,607 | 150,322 | 4.2 % | |||
Total order book | 6,386,284 | 6,157,507 | 3.7 % |
Consolidated revenue
in CHF m
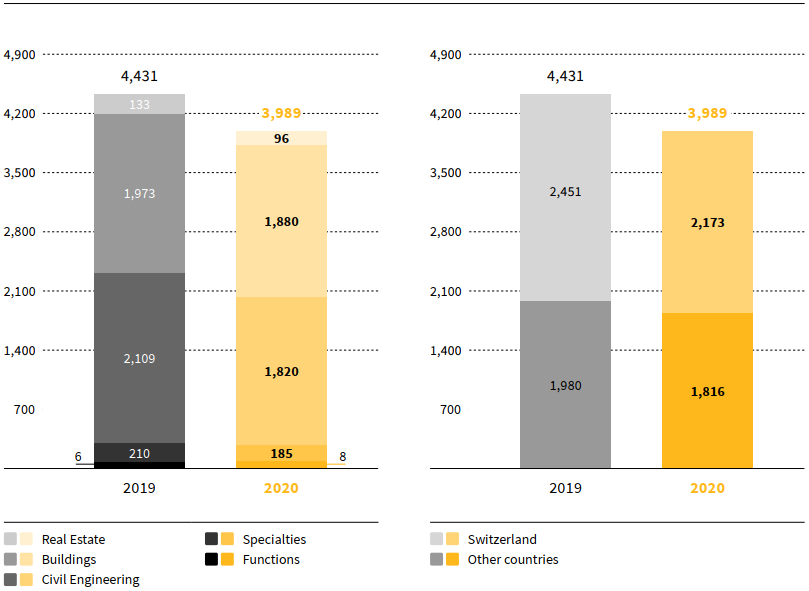
Consolidated revenue | ||||||
in TCHF | 2020 | 2019 | Δ | |||
Real Estate | 124,466 | 160,419 | (22.4 %) | |||
Buildings | 2,079,821 | 2,241,754 | (7.2 %) | |||
Civil Engineering | 2,012,855 | 2,300,218 | (12.5 %) | |||
Specialties | 223,628 | 242,021 | (7.6 %) | |||
Functions / elimination of intra-group services | (451,824) | (513,579) | 12.0 % | |||
Total revenue | 3,988,946 | 4,430,833 | (10.0 %) |
Positive market outlook despite COVID-19
The market outlook remains positive despite the COVID-19 pandemic. Total construction output in the EU-15 countries is expected to stabilise, with annual growth rates of 2.7% in the 2021-2023 period for Buildings and 3.3% for Civil Engineering (Euroconstruct, November 2020). The market forecast for large infrastructure projects is promising thanks to the expected economic stimulus packages and an investment backlog within the infrastructure sector. You can read more about this in the Business report.
Implenia is well positioned and on track to establish itself as a strong and profitable company with a substantially improved risk profile. With the positive market outlook, bolstered by the megatrends of urbanisation, mobility and infrastructure investments, the Group is firmly on its way to realise its vision of becoming a leading multinational integrated construction and real estate services provider.
In line with its asset light strategy, Implenia will report future performance in EBIT. For 2021, an EBIT of CHF >100 million corresponding to EBIT margin of ~2.8% is expected, an equivalent of CHF >200 million EBITDA. The mid-term target of an expected EBIT margin of 4.5% (6.5% EBITDA margin) is confirmed.
At the end of 2020, Implenia employed 8,701 people (full-time equivalents, excluding temporary employees), compared with 8,867 at the end of 2019.
EBITDA | ||||||
in TCHF | 2020 | 2019 | Δ | |||
Real Estate | 110,624 | 44,474 | 148.7 % | |||
Buildings | (6,129) | 51,477 | ||||
Civil Engineering | (101,217) | 77,221 | ||||
Specialties | 2,836 | 19,234 | (85.3 %) | |||
Functions | (11,005) | (5,638) | (95.2 %) | |||
Total EBITDA | (4,891) | 186,768 |
Production output
in CHF m
EBITDA
in CHF m
EBIT
in CHF m
Net result
in CHF m
Invested capital | ||||||
in TCHF | 31.12.2020 | 31.12.2019 | Δ | |||
Current assets (excl. cash and cash equivalents) | 1,230,843 | 1,314,319 | (6.4 %) | |||
Non-current assets (excl. pension assets and rights of use from leases) | 824,528 | 704,437 | 17.0 % | |||
Less debt capital (excl. financial liabilities and pension liabilities) | (1,885,928) | (1,830,328) | (3.0 %) | |||
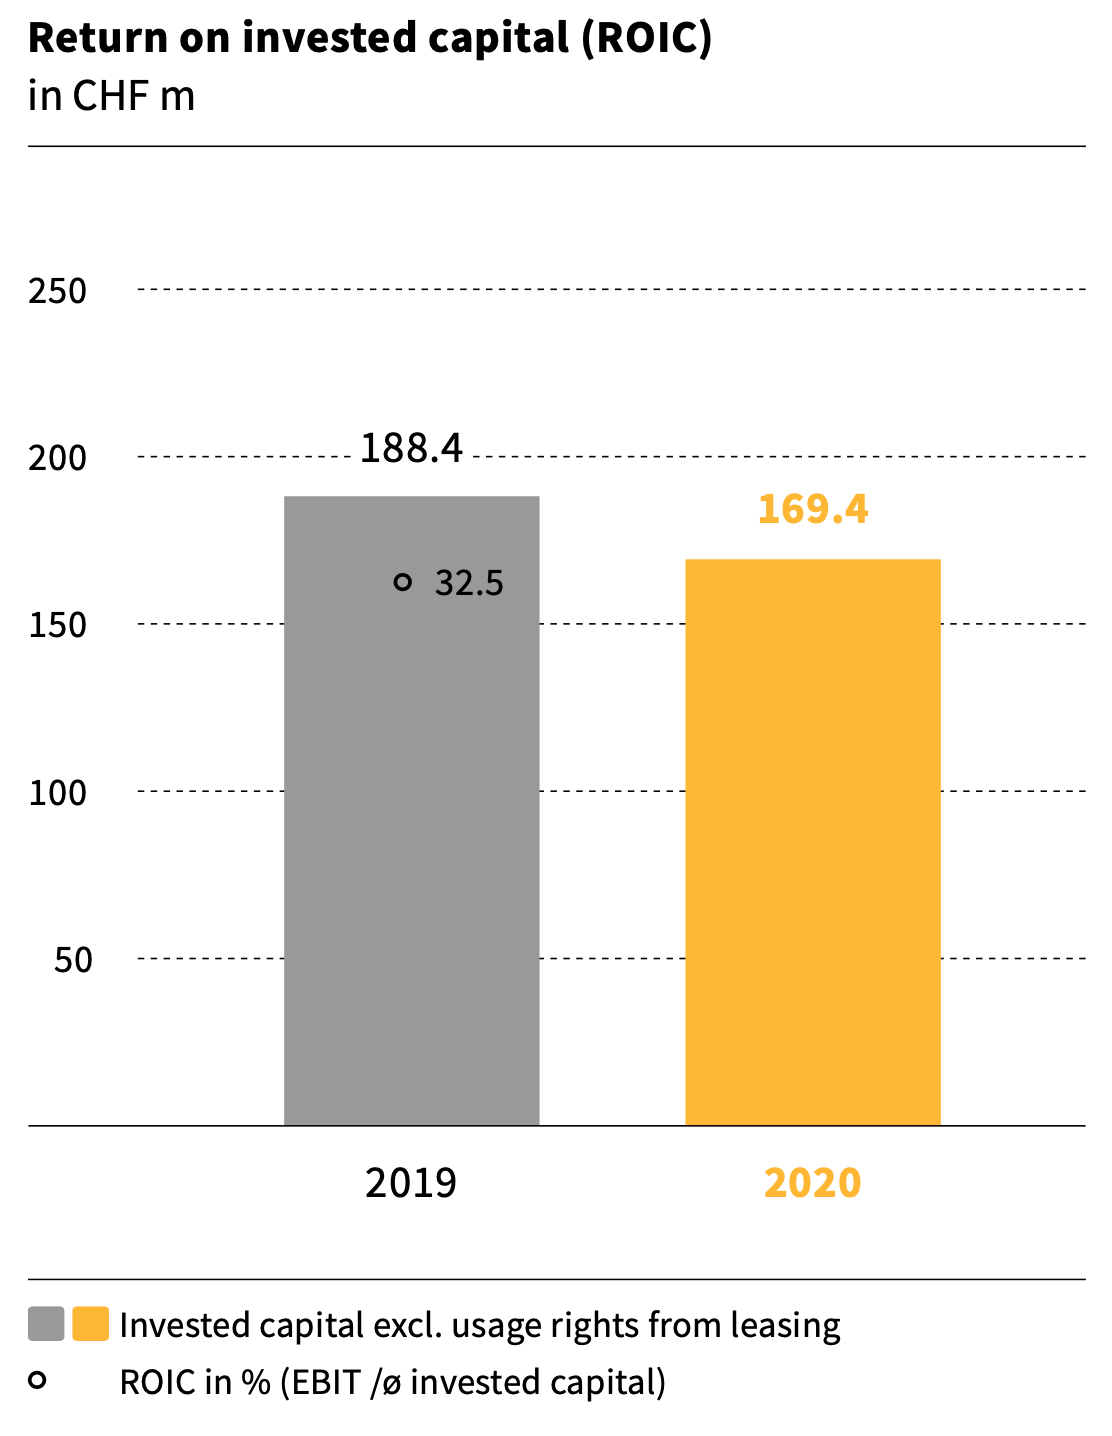
Invested capital excl. rights of use from leases | 169,443 | 188,428 | (10.1 %) | |||
Rights of use from leases | 167,306 | 146,491 | 14.2 % | |||
Total invested capital | 336,749 | 334,919 | 0.5 % |
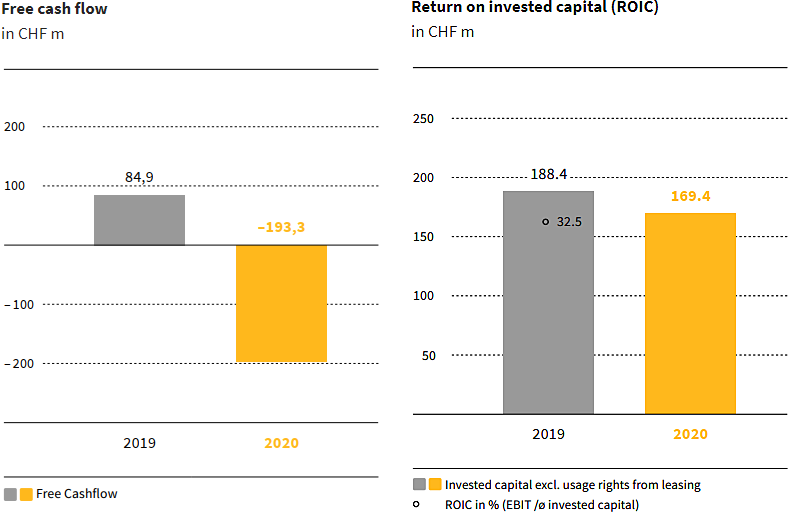
Free cash flow
in CHF m
Return on invested capital (ROIC)
in CHF m
Net cash position, excluding liabilities from leasing
in CHF m
