Key figures for the Group
Consolidated key figures | ||||||||
in TCHF | 2023 | 2022 | Δ | Δ like-for-like1 | ||||
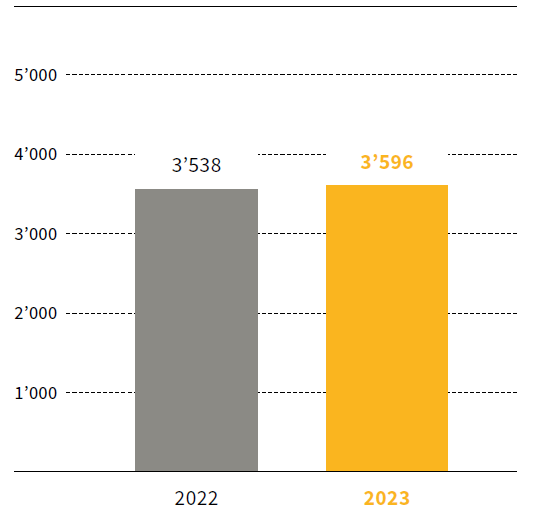
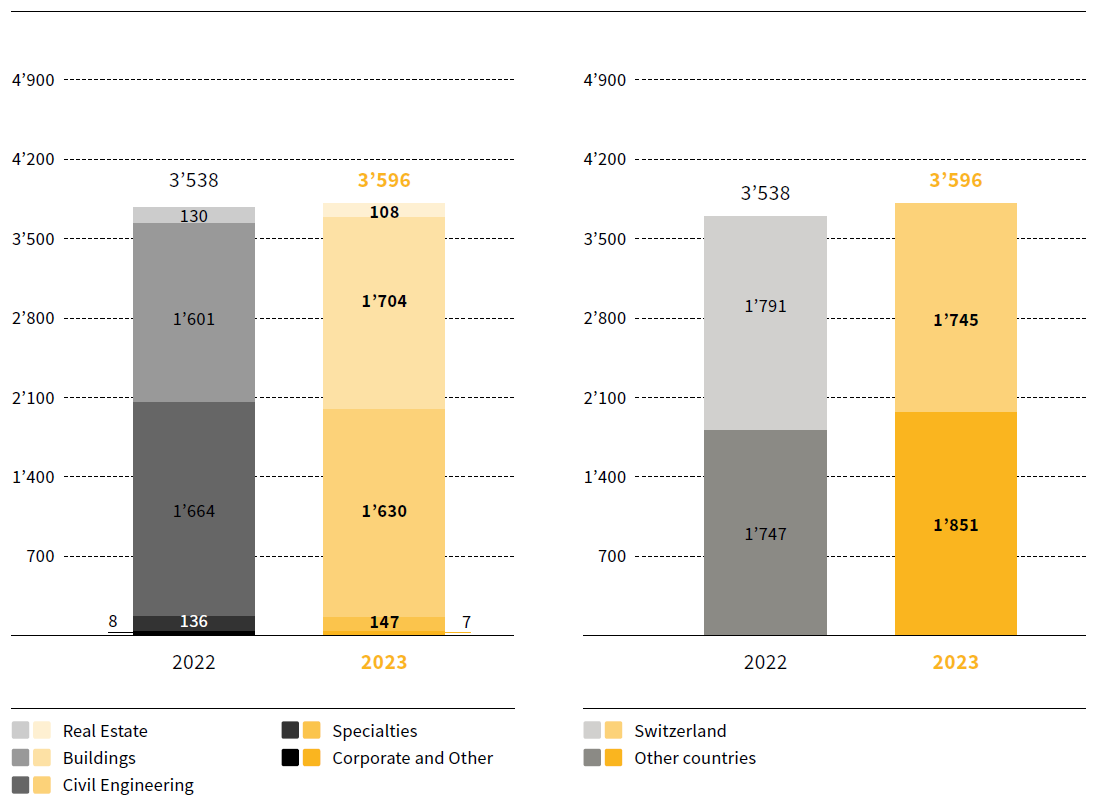
Consolidated revenue | 3,595,909 | 3,538,344 | 1.6 % | 4.9 % | ||||
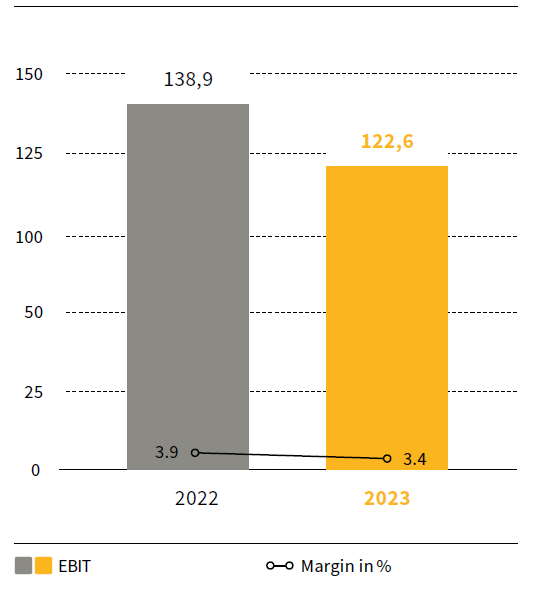
EBIT | 122,620 | 138,861 | ||||||
in % of consolidated revenue | 3.4 % | 3.9 % | ||||||
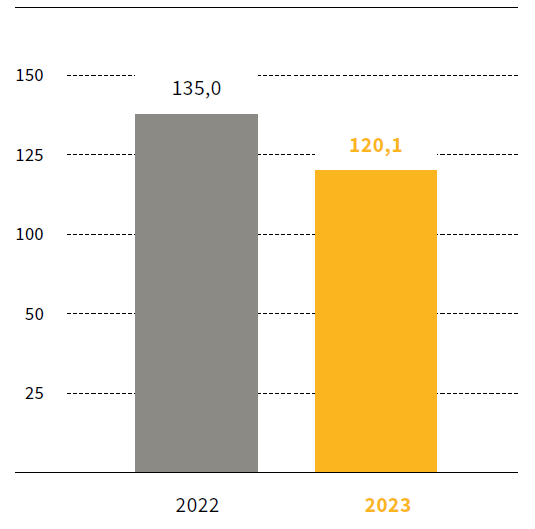
Consolidated profit | 141,757 | 105,963 | ||||||
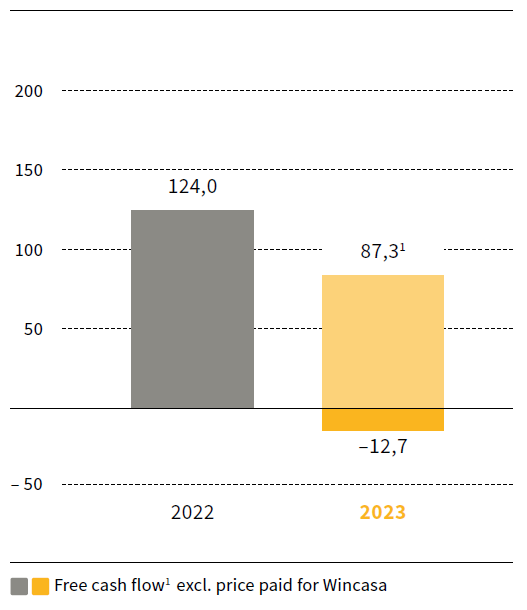
Free cash flow | (12,659) | 123,997 | ||||||
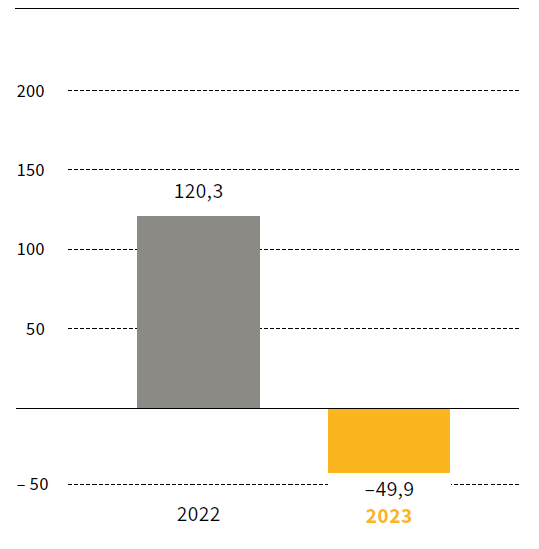
Net cash position excl. lease liabilities (as at 31.12.) | (49,897) | 120,336 | (141.5 %) | (129.4 %) | ||||
Net cash position (as at 31.12.) | (232,091) | (45,439) | (410.8 %) | (398.3 %) | ||||
Equity (as at 31.12.) | 575,775 | 482,670 | 19.3 % | 24.9 % | ||||
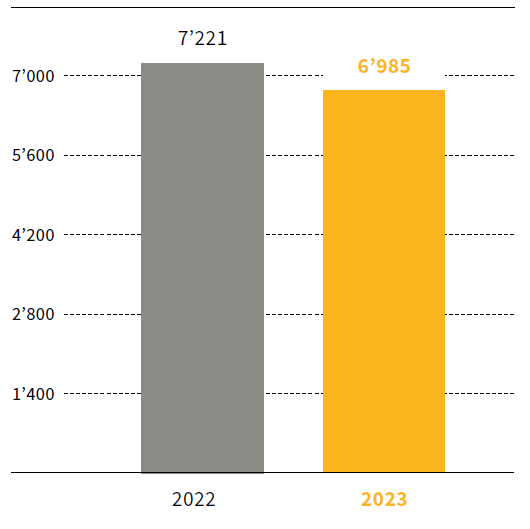
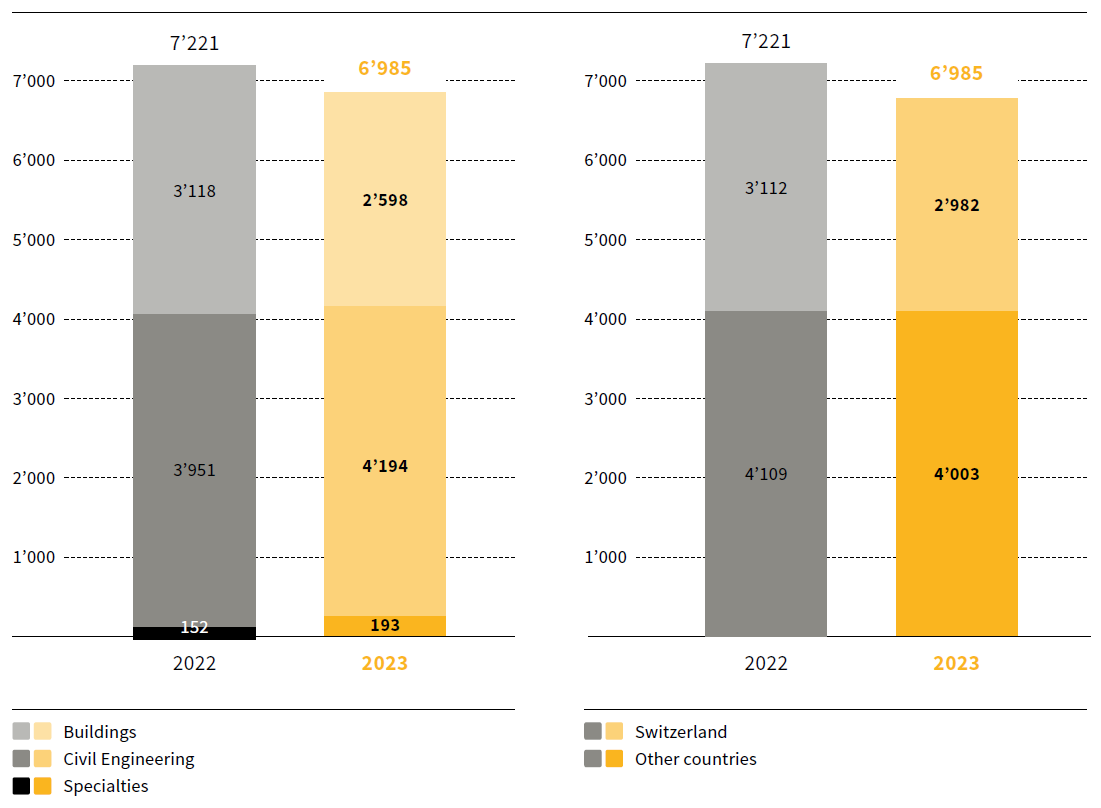
Order book (as at 31.12.) | 6,985,442 | 7,221,306 | (3.3 %) | 1.0 % | ||||
Production output | 4,203,874 | 4,152,567 | 1.2 % | 4.0 % | ||||
Workforce (FTE; as at 31.12.) | 9,056 | 7,639 | 18.5 % |
1 Foreign currency adjusted
With EBIT of CHF 122.6 million, currency-adjusted CHF 126.5 million, Implenia achieved the target; consolidated profit at record level of CHF 141.8 million
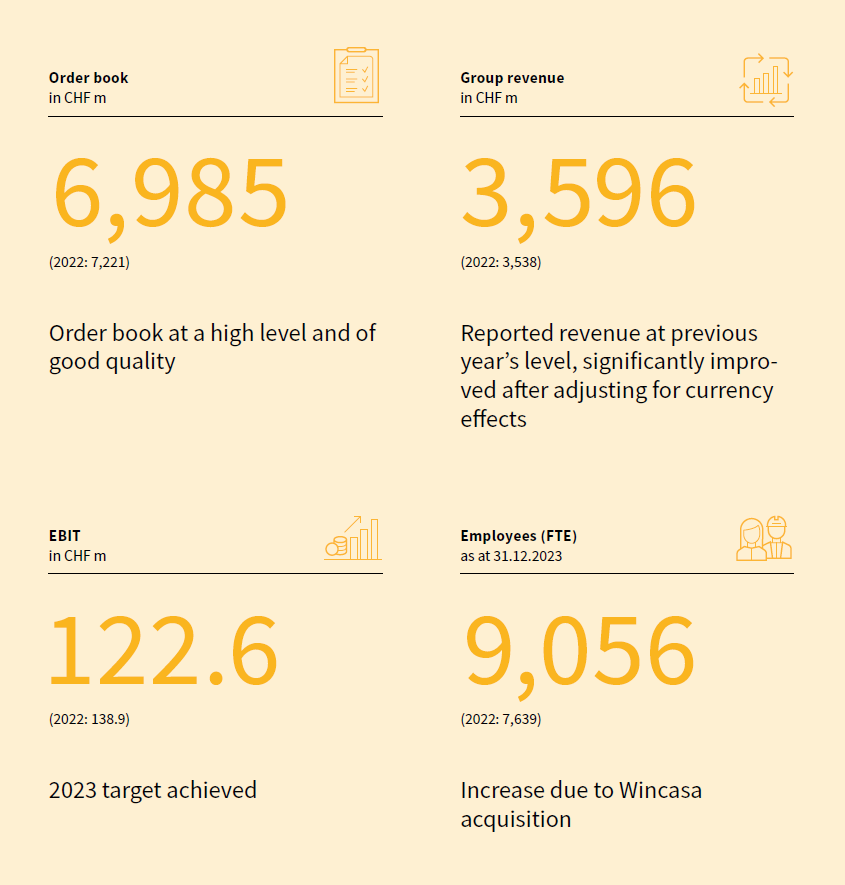
Implenia achieved EBIT of CHF 122.6 million (2022: CHF 138.9 million, including the above-average earnings of Division Real Estate), or CHF 126.5 million after adjusting for currency effects. Group revenue was CHF 3,596 million (2022: CHF 3,538 million), which was significantly higher than the previous year's level after adjusting for currency effects. The EBIT margin was 3.4% (2022: 3.9%). The order book remained at a high level of CHF 7,293 million after adjusting for currency effects, or CHF 6,985 million reported (2022: CHF 7,221 million). Strict application of Value Assurance, Implenia's risk management, ensures that the projects in the order book have a solid risk and margin profile. Consolidated profit stood at a record level of CHF 141.8 million (2022: CHF 106.0 million), thanks to a strong operating business and capitalisation of deferred tax assets on loss carry-forwards.
The Group generated a free cash flow of CHF 87.3 million (excluding the price paid for Wincasa) and improved its equity ratio to 19.8%, currency-adjusted 20.0%
Implenia's equity increased by CHF 93.1 million to CHF 575.8 million in financial year 2023 (2022: CHF 482.7 million). The Group increased its equity ratio to 19.8% (2022: 17.5%), currency-adjusted 20.0% as of 31 December 2023. This further strengthens its financial stability. Due to the acquisition of Wincasa, total assets increased to CHF 2,906 million (2022: CHF 2,753 million). Free cash flow came to CHF −12.7 million (2022: CHF 124.0 million), or CHF 87.3 million excluding the CHF 100 million already paid for Wincasa.
Implenia is aiming for EBIT of CHF ~130 million in 2024 and is confirming its medium-term financial targets
Implenia expects EBIT of CHF ~130 million for financial year 2024 based on a strong operating business in a challenging market environment. As a mid-term target, the Group is aiming for an EBIT margin of >4.5% and an equity ratio of 25%.
There is still high and rising demand for large-scale real estate projects in attractive urban locations as well as for complex infrastructure projects. This demand is being stimulated by the megatrends of population growth and urbanisation, the energy transition and investments in new or modernised transport and energy infrastructure.
With its comprehensive, integrated portfolio of services along the entire value chain and its sector-oriented specialisations (healthcare, research, transport and energy infrastructure, etc.), Implenia is excellently positioned in these areas. Based on many years of experience, the Group has built up comprehensive capabilities for its differentiated and scalable range of services. Its portfolio mix of sought-after real estate and infrastructure services enables sustainably profitable growth. By combining organic and inorganic growth, backed by an asset-light strategy, the Group is also tapping into innovative, high-margin business areas.
Key balance sheet figures | ||||||
in TCHF | 31.12.2023 | 31.12.2022 | Δ | |||
Cash and cash equivalents and fixed short-term deposits | 478,809 | 609,040 | (21.4 %) | |||
Real estate transactions | 149,136 | 141,026 | 5.8 % | |||
Other current assets | 1,102,142 | 1,084,524 | 1.6 % | |||
Non-current assets | 1,175,454 | 918,836 | 27.9 % | |||
Total assets | 2,905,541 | 2,753,426 | 5.5 % | |||
Financial liabilities | 710,900 | 654,479 | 8.6 % | |||
Other liabilities | 1,618,866 | 1,616,277 | 0.2 % | |||
Equity | 575,775 | 482,670 | 19.3 % | |||
Total equity and liabilities | 2,905,541 | 2,753,426 | 5.5 % | |||
Net cash position excl. lease liabilities (as at 31.12.) | (49,897) | 120,336 | (141.5 %) | |||
Investments in real estate transactions | 37,832 | 19,915 | 90.0 % | |||
Investments in fixed assets | 51,641 | 44,238 | 16.7 % | |||
Equity ratio | 19.8 % | 17.5 % |
EBIT | ||||||
in TCHF | 2023 | 2022 | Δ | |||
Real Estate | 40,473 | 81,069 | (50.1 %) | |||
Buildings | 42,819 | 35,372 | 21.1 % | |||
Civil Engineering | 37,674 | 35,751 | 5.4 % | |||
Specialties | 7,617 | 4,412 | 72.6 % | |||
Corporate and Other | (5,963) | (17,743) | 66.4 % | |||
EBIT Total | 122,620 | 138,861 | (11.7 %) |
Order book | ||||||
in TCHF | 31.12.2023 | 31.12.2022 | Δ | |||
Buildings | 2,598,423 | 3,118,421 | (16.7 %) | |||
Civil Engineering | 4,193,821 | 3,950,989 | 6.1 % | |||
Specialties | 193,198 | 151,896 | 27.2 % | |||
Total order book | 6,985,442 | 7,221,306 | (3.3 %) |
Consolidated revenue | ||||||
in TCHF | 2023 | 2022 | Δ | |||
Real Estate | 111,576 | 144,818 | (23.0 %) | |||
Buildings | 1,861,081 | 1,745,165 | 6.6 % | |||
Civil Engineering | 1,846,491 | 1,894,966 | (2.6 %) | |||
Specialties | 156,802 | 163,005 | (3.8 %) | |||
Corporate and Other / elimination of | (380,041) | (409,610) | 7.2 % | |||
Total consolidated revenue | 3,595,909 | 3,538,344 | 1.6 % |
Invested capital | ||||||
in TCHF | 31.12.2023 | 31.12.2022 | Δ | |||
Current assets (excl. cash and cash equivalents and fixed short-term deposits) | 1,251,278 | 1,225,550 | 2.1 % | |||
Non-current assets (excl. pension assets and rights of use from leases) | 1,001,071 | 761,735 | 31.4 % | |||
Debt capital (excl. financial and pension liabilities) | (1,609,910) | (1,606,374) | (0.2 %) | |||
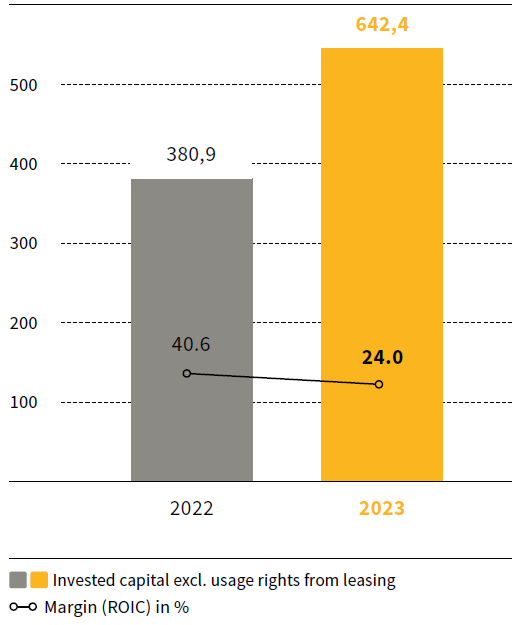
Total invested capital excl. rights of use from leases | 642,439 | 380,911 | 68.7 % | |||
Rights of use from leases | 173,939 | 156,657 | 11.0 % | |||
Total invested capital1 | 816,378 | 537,568 | 51.9 % |
1 Debt capital (excl. financial and pension liabilities) excl. rights of use from leases includes provisions for onerous lease contracts that under IFRS 16 are reflected as impairment on the right of use asset (see note 18)
