Key figures for the Group

Consolidated key figures | ||||||||
in TCHF | 2024 | 2023 | Δ | Δ like-for-like1 | ||||
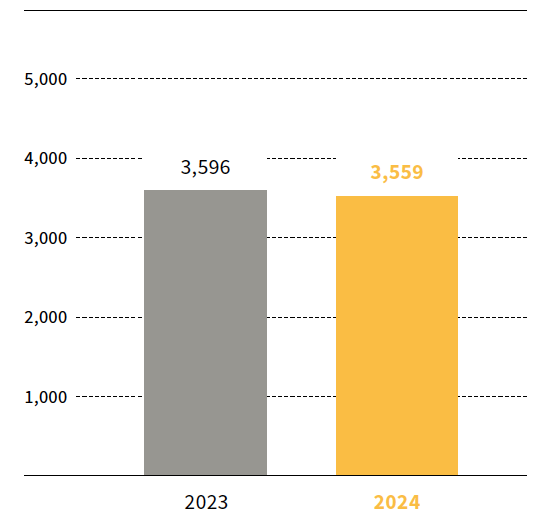
Consolidated revenue | 3,558,912 | 3,595,909 | (1.0 %) | 0.1 % | ||||
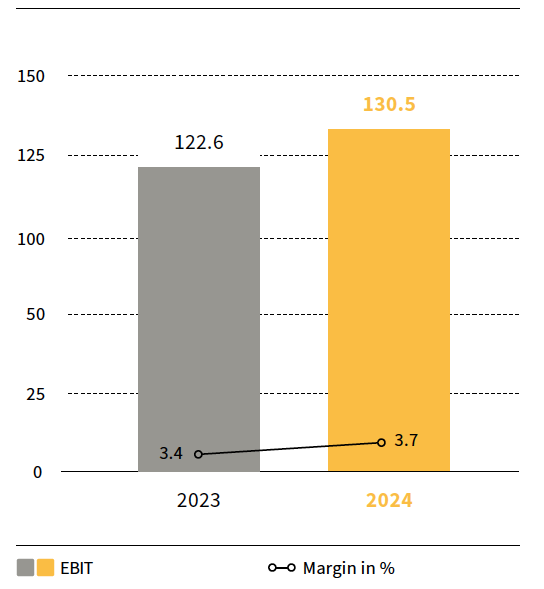
EBIT | 130,477 | 122,620 | ||||||
in % of consolidated revenue | 3.7 % | 3.4 % | ||||||
Consolidated profit | 93,351 | 141,757 | ||||||
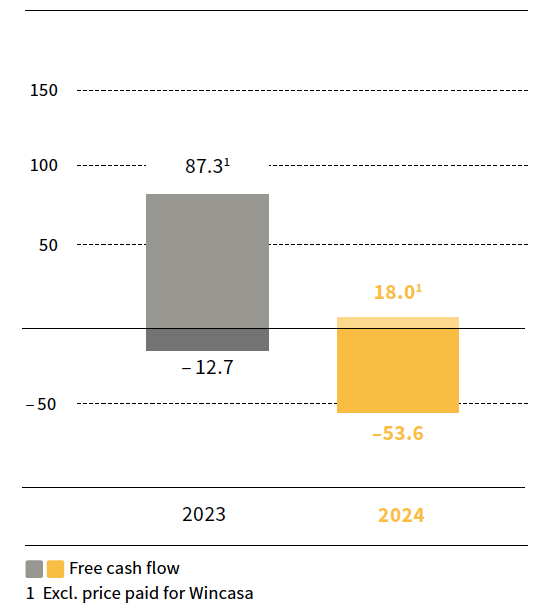
Free cash flow | (53,556) | (12,659) | ||||||
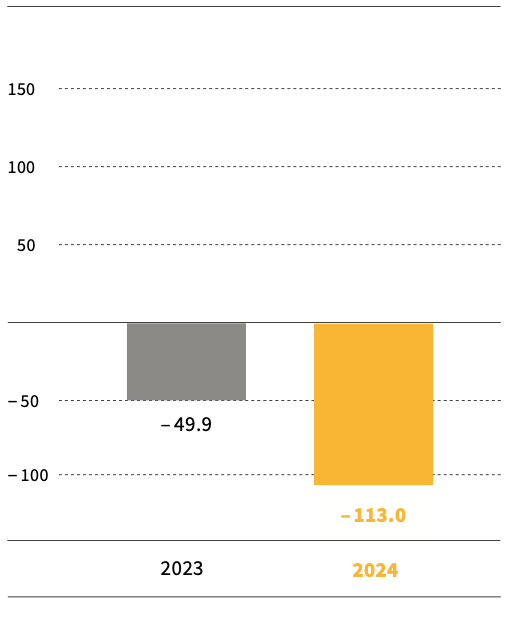
Net cash position excl. lease liabilities (as at 31.12.) | (113,325) | (49,896) | (127.1 %) | (127.6 %) | ||||
Net cash position (as at 31.12.) | (284,605) | (232,091) | (22.6 %) | (23.2 %) | ||||
Equity (as at 31.12.) | 656,669 | 575,775 | 14.0 % | 13.7 % | ||||
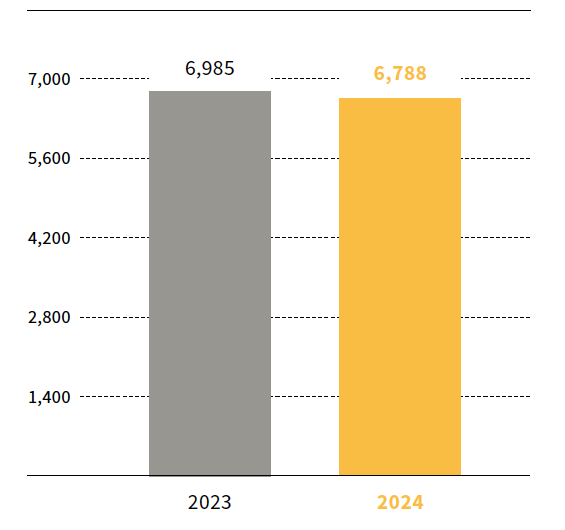
Order book (as at 31.12.) | 6,788,275 | 6,985,442 | (2.8 %) | (3.1 %) | ||||
Production output | 4,293,651 | 4,203,874 | 2.1 % | 2.8 % | ||||
Workforce (FTE; as at 31.12.) | 9,046 | 9,056 | (0.1 %) |
1 Foreign currency adjusted
Increased profitability: EBIT CHF 130.5 million, EBIT margin enhanced to 3.7%
Implenia achieved EBIT of CHF 130.5 million (2023: CHF 122.6 million), or CHF 131.0 million after adjusting for currency effects. The EBIT margin rose to 3.7% (2023: 3.4%). Group revenue, at CHF 3,559 million (2023: CHF 3,596 million), was at previous year's level. The order book remained high at CHF 6,788 million (2023: CHF 6,985 million) and is of good quality. Strict application of Value Assurance, Implenia's risk management, ensures that these projects have a solid risk and margin profile. Consolidated profit stood at CHF 93.4 million (2023: CHF 141.8 million) and, as expected, was not comparable to the previous year due to differences in the capitalisation of deferred tax assets on loss carry-forwards.
The Group reaffirms and continues to implement its successful strategy, which has four priorities: Portfolio, Profitable Growth, Innovation and Talent & Organisation. In addition to optimising and developing its existing business, Implenia is expanding its portfolio by adding higher-margin services along the value chain through organic and inorganic growth.
Equity ratio improved to 21.2%; Adjusted free cash flow of CHF 58.2 million (excl. Wincasa M&A and above-average net investment in real estate portfolio)
Implenia's equity increased by CHF 80.9 million to CHF 656.7 million in financial 2024 (2023: CHF 575.8 million). The Group improved its equity ratio to 21.2% as of 31 December 2024 (2023: 19.8%), further strengthening its financial stability. Total assets rose to CHF 3,098 million (2023: CHF 2,906 million), mainly due to the acquisition of additional shares in a joint venture and below-average real estate sales. Reported free cash flow amounted to CHF -53.6 million. Adjusted free cash flow, excluding Wincasa M&A and above-average net investments in the real estate portfolio, amounted to CHF 58.2 million. As of 31 December 2024, all syndicated cash limits were unused and fully available to the company.
The Group is aiming for EBIT of CHF ~140 million in 2025 and confirms its medium-term financial targets
Implenia expects EBIT of CHF ~140 million for financial year 2025 based on strong operating business in a challenging market environment. As a mid-term financial target, the Group is aiming for an EBIT margin of >4.5% and an equity ratio of 25%.
The megatrends of population growth and urbanisation, energy transition and investment in new or modernised transport and energy infrastructure continue to stimulate demand for real estate projects in attractive urban locations as well as for large infrastructure projects.
Within building construction, the new-build sector in Switzerland is forecast to grow in 2025, while the recovery in Germany will be further delayed. Solid growth is expected in the market for renovating existing properties in both Switzerland and Germany. The civil engineering sector will continue to grow in Western European markets in 2025, driven by the need for public sector investment in modern infrastructure for transport and renewable energy (e.g. increasing demand for pumped storage power plants).
With its comprehensive, integrated portfolio of services along the entire value chain and its sector-oriented specialisations, Implenia is excellently positioned to take on challenging projects in these areas.
Key balance sheet figures | ||||||
in TCHF | 31.12.2024 | 31.12.2023 | Δ | |||
Cash and cash equivalents | 401,995 | 478,809 | (16.0 %) | |||
Real estate transactions | 190,680 | 149,136 | 27.9 % | |||
Other current assets | 1,293,504 | 1,102,142 | 17.4 % | |||
Non-current assets | 1,212,252 | 1,175,454 | 3.1 % | |||
Total assets | 3,098,431 | 2,905,541 | 6.6 % | |||
Financial liabilities | 686,600 | 710,900 | (3.4 %) | |||
Other liabilities | 1,755,162 | 1,618,866 | 8.4 % | |||
Equity | 656,669 | 575,775 | 14.0 % | |||
Total equity and liabilities | 3,098,431 | 2,905,541 | 6.6 % | |||
Net cash position excl. | (113,324) | (49,896) | (127.1 %) | |||
Investments in real estate transactions | 65,153 | 37,832 | 72.2 % | |||
Investments in fixed assets | 69,045 | 51,641 | 33.7 % | |||
Equity ratio | 21.2 % | 19.8 % |
EBIT | ||||||
in TCHF | 2024 | 2023 | Δ | |||
Real Estate | 37,242 | 40,473 | (8.0 %) | |||
Buildings | 55,510 | 42,819 | 29.6 % | |||
Civil Engineering | 39,679 | 37,674 | 5.3 % | |||
Specialties | 8,625 | 7,617 | 13.2 % | |||
Corporate and Other | (10,579) | (5,963) | 77.4 % | |||
EBIT Total | 130,477 | 122,620 | 6.4 % |
Order book
in CHF m
Group revenue
in CHF m
EBIT
in CHF m
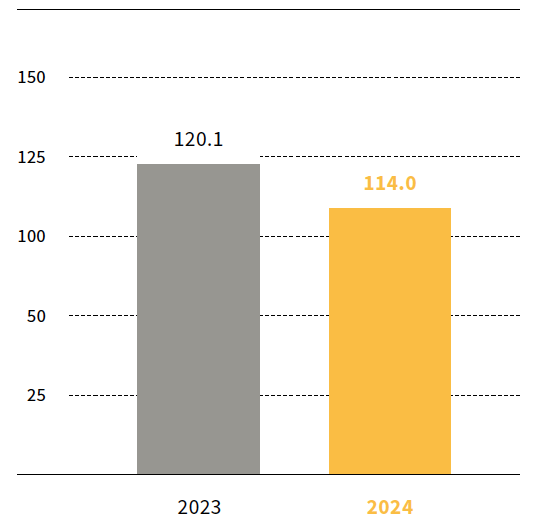
Operating performance
in CHF m
Order book
in CHF m
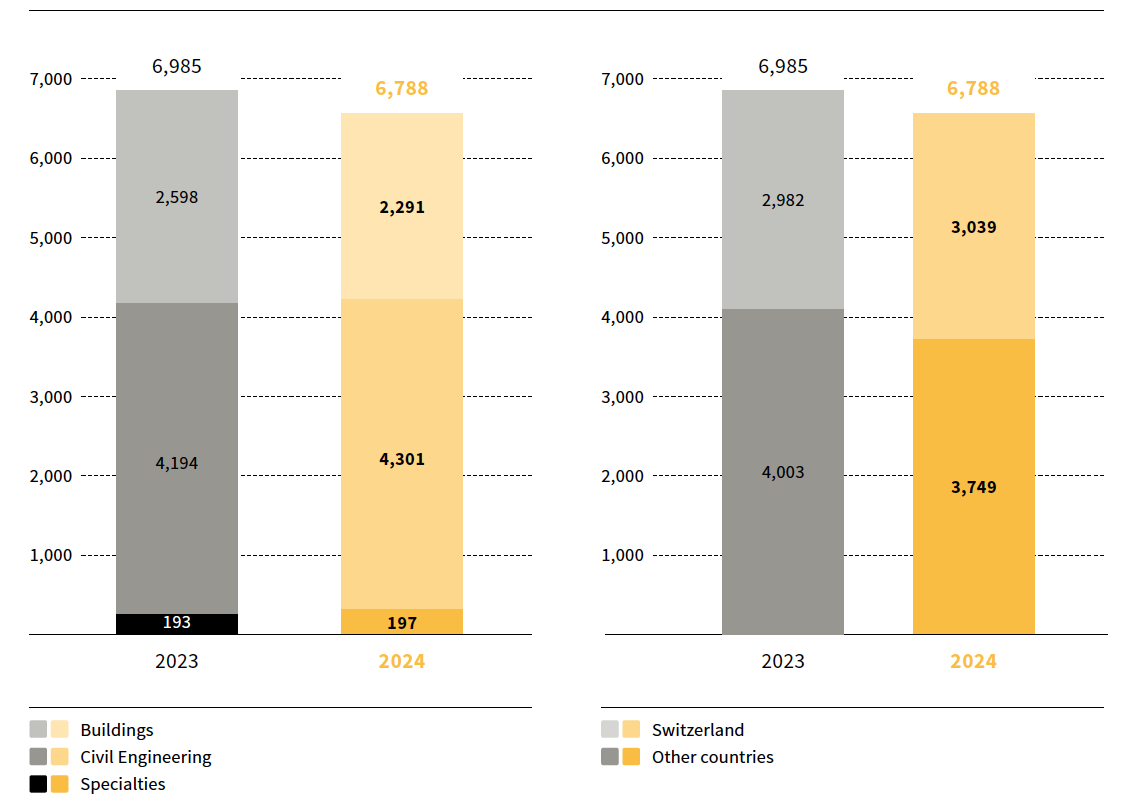
Order book | ||||||
in TCHF | 31.12.2024 | 31.12.2023 | Δ | |||
Buildings | 2,290,872 | 2,598,423 | (11.8 %) | |||
Civil Engineering | 4,300,891 | 4,193,821 | 2.6 % | |||
Specialties | 196,512 | 193,198 | 1.7 % | |||
Total order book | 6,788,275 | 6,985,442 | (2.8 %) |
Group revenue, consolidated
in CHF m
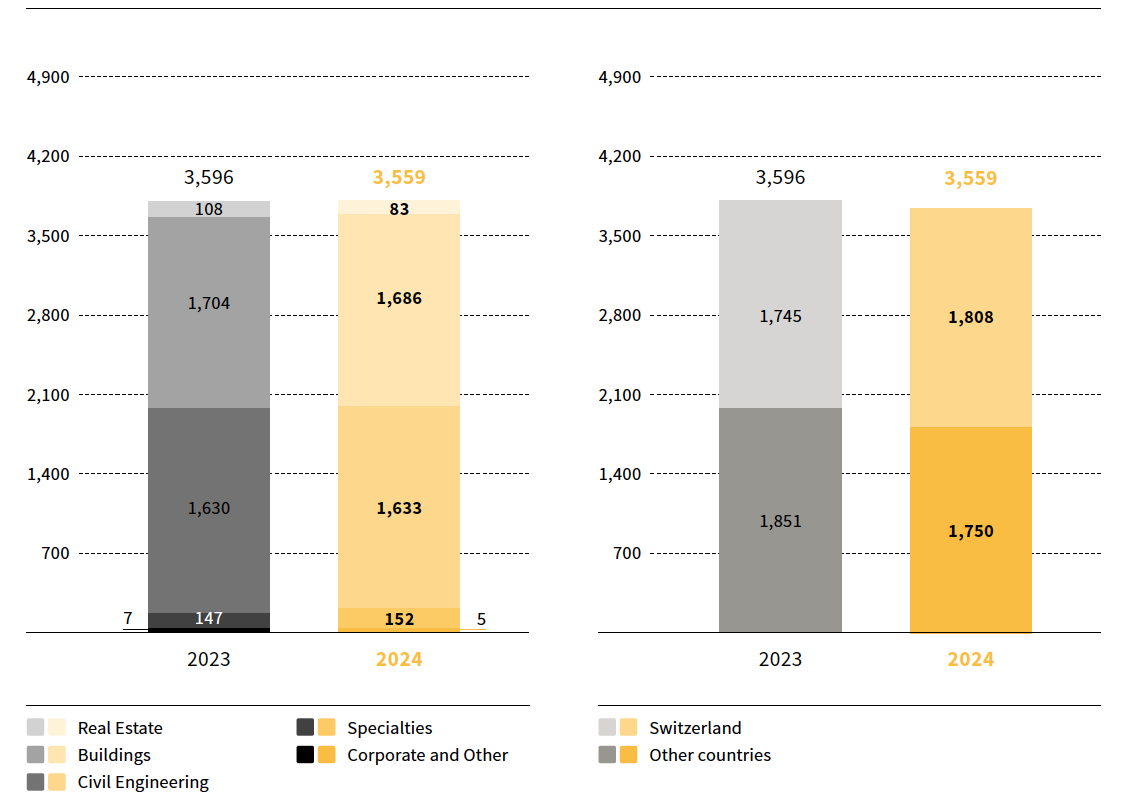
Consolidated revenue | ||||||
in TCHF | 2024 | 2023 | Δ | |||
Real Estate | 100,492 | 111,576 | (9.9 %) | |||
Buildings | 1,818,062 | 1,861,081 | (2.3 %) | |||
Civil Engineering | 1,820,475 | 1,846,491 | (1.4 %) | |||
Specialties | 168,860 | 156,802 | 7.7 % | |||
Corporate and Other / elimination of intra-Group services | (348,977) | (380,041) | (8.2 %) | |||
Total consolidated revenue | 3,558,912 | 3,595,909 | (1.0 %) |
Free cash flow
in CHF m
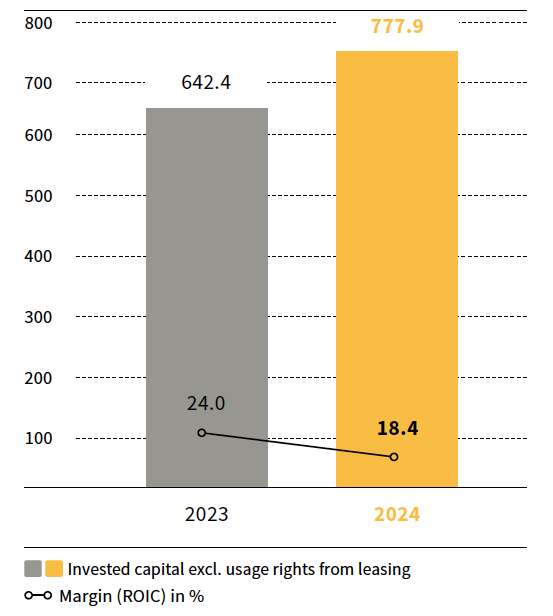
Return on invested capital (ROIC)
in CHF m
Net cash position, excluding liabilities from leasing
in CHF m
Invested capital | ||||||
in TCHF | 31.12.2024 | 31.12.2023 | Δ | |||
Current assets (excl. cash and cash equivalents and fixed short-term deposits) | 1,484,184 | 1,251,278 | 18.6 % | |||
Non-current assets (excl. pension assets and rights of use from leases) | 1,042,489 | 1,001,071 | 4.1 % | |||
Debt capital (excl. financial and pension liabilities) | (1,748,725) | (1,609,910) | 8.6 % | |||
Total invested capital excl. rights of use from leases | 777,947 | 642,439 | 21.1 % | |||
Rights of use from leases | 162,557 | 173,939 | (6.5 %) | |||
Total invested capital1 | 940,504 | 816,378 | 15.2 % |
1 Debt capital (excl. financial and pension liabilities) excl. rights of use from leases includes provisions for onerous lease contracts that under IFRS 16 are reflected as impairment on the right of use asset.