Share and Financing
1 Subject to approval by the Annual General Meeting of Shareholders.
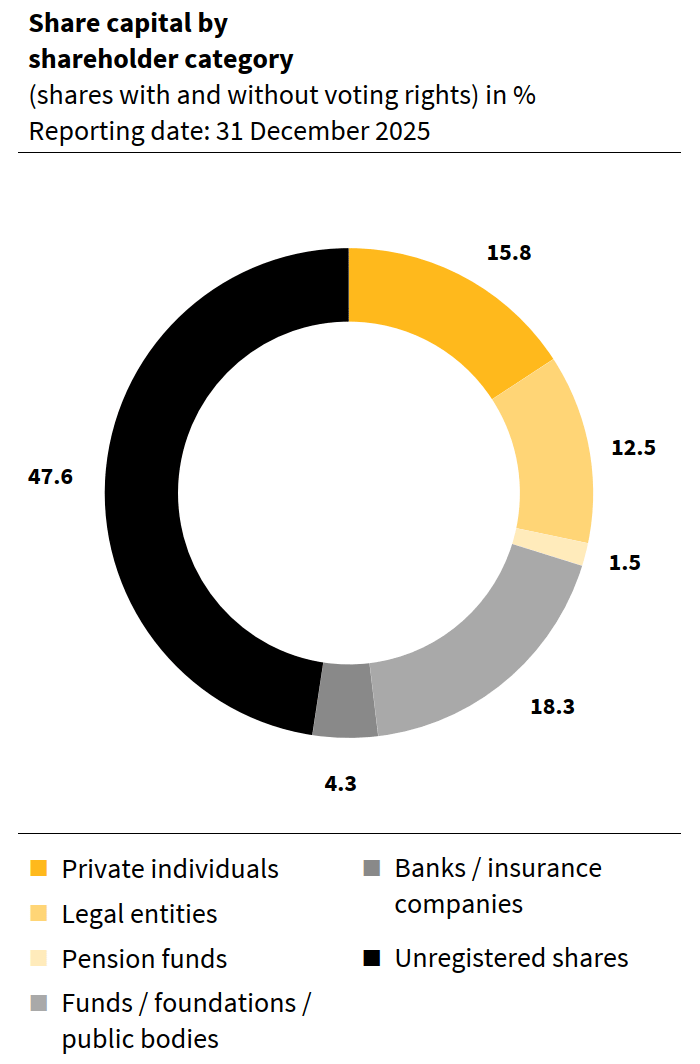
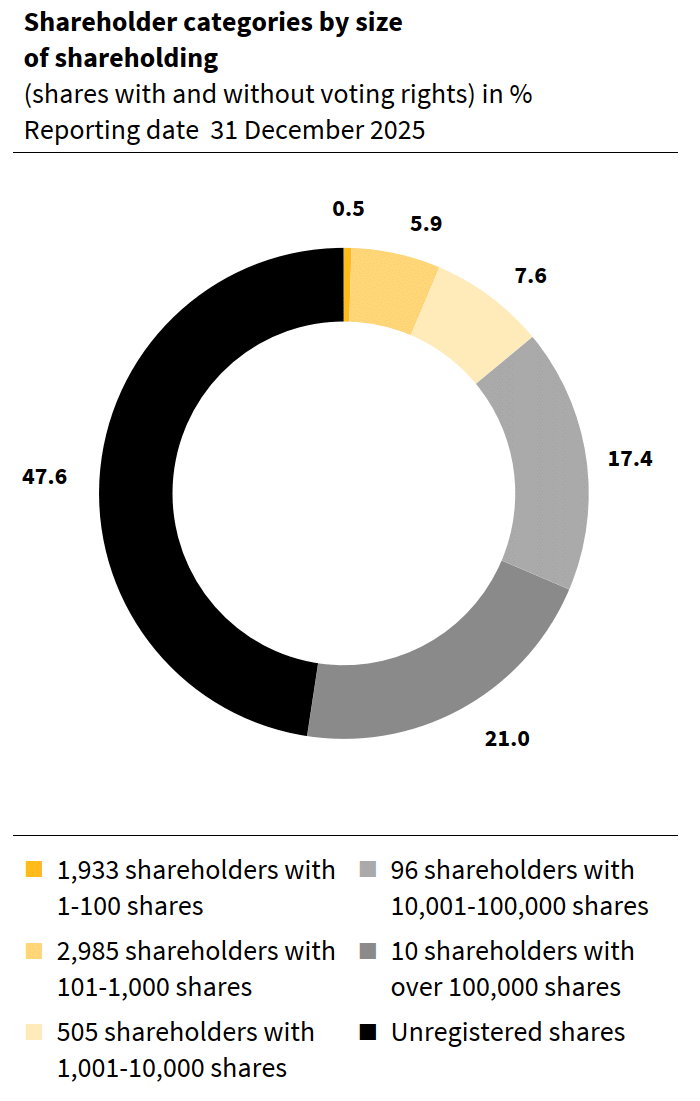
Information about Implenia’s shares
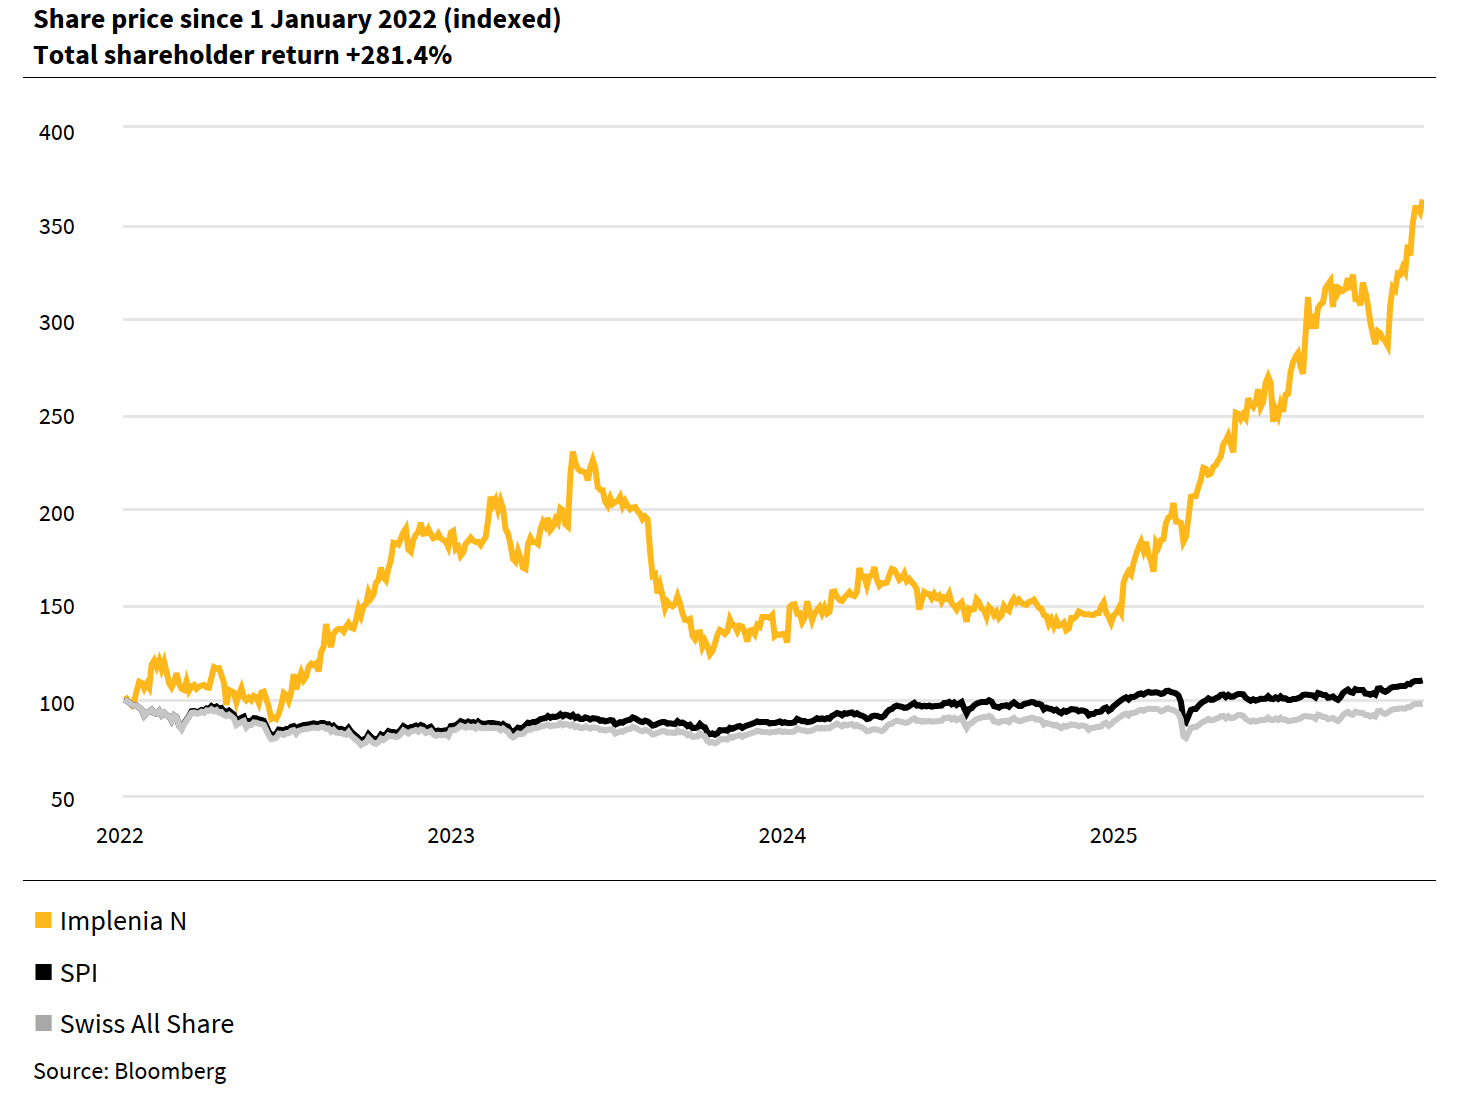
Review
The average number of shares traded each day rose to approximately 62,000 in 2025, compared with approximately 29,000 in the previous year. The average daily trading volume rose to CHF 3.2 million (from CHF 0.9 million in 2024). Implenia’s closing price at the end of 2025 was CHF 76.50 (closing price in 2024: CHF 30.70), an increase of 149.2%.
Dividend policy and returns
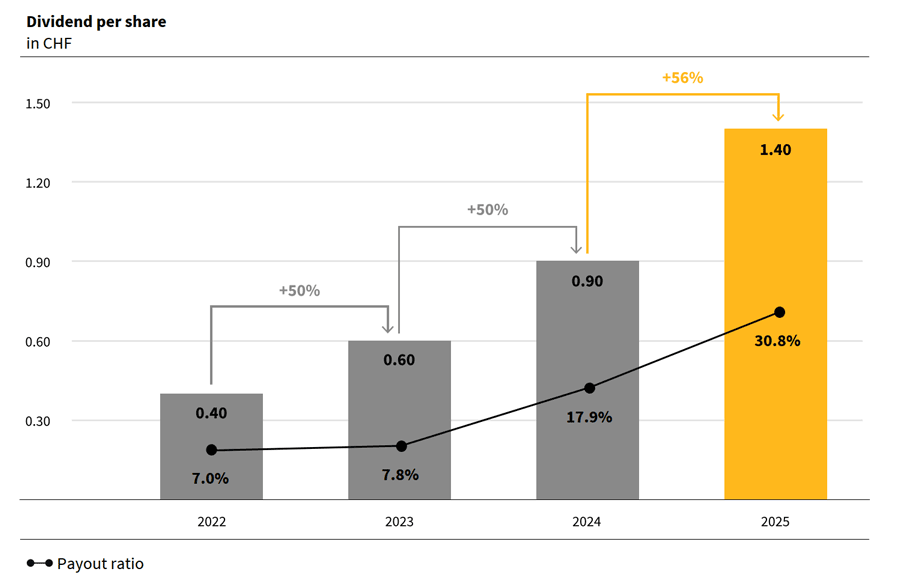
The Board of Directors will propose an increased dividend of CHF 1.40 per share to the Annual General Meeting
Based on the economic success and a further strengthening of the balance sheet, the Board of Directors will propose an increase in the dividend of 56% to CHF 1.40 (previous year: CHF 0.90) per share at the Annual General Meeting of Shareholders on 31 March 2026.
Key data
| Symbol | IMPN |
|---|---|
| Securities no. | 2386855 |
| ISIN | CH002 386 8554 |
Index membership
- SPI
- SPI ESG
- SPI ESG Select
- SPI ex SLI
- SPI EXTRA
- Swiss All Share
Share capital
| 31.12.2025 | 31.12.2024 | 31.12.2023 | 31.12.2022 | 31.12.2021 | |
|---|---|---|---|---|---|
| Share capital (in TCHF) | 18,841 | 18,841 | 18,841 | 18,841 | 18,841 |
| Number of registered shares issued | 18,472,000 | 18,472,000 | 18,472,000 | 18,472,000 | 18,472,000 |
| of which treasury shares | 7,542 | 85,697 | 264,172 | 64,954 | 63,854 |
| Number of outstanding registered shares | 18,464,458 | 18,386,303 | 18,207,828 | 18,407,046 | 18,408,146 |
| Par value of registered shares (in CHF) | 1.02 | 1.02 | 1.02 | 1.02 | 1.02 |
| Conditional / authorised capital (in TCHF) | – | – | 3,768 | 3,768 | 3,768 |
| Capital spread (in TCHF) | 7,537 | 7,537 | – | – | – |
Key figures
| 31.12.2025 | 31.12.2024 | 31.12.2023 | 31.12.2022 | 31.12.2022 | |
|---|---|---|---|---|---|
| Earnings per share (in CHF) | 4.55 | 5.04 | 7.69 | 5.68 | 3.31 |
| Price-to-earnings ratio | 16.8 | 6.1 | 4.0 | 6.7 | 6.0 |
| Equity capital per share (CHF) | 40.78 | 35.55 | 31.17 | 26.13 | 18.73 |
| Gross dividend1(in CHF) | 1.40 | 0.90 | 0.60 | 0.40 | - |
| Dividend yield (in %) | 1.8 | 2.9 | 2.0 | 1.1 | – |
| Payout ratio (in %) | 30.8 | 17.9 | 7.8 | 7.0 | – |
1 2025: Subject to approval by the Annual General Meeting of Shareholders.
Major shareholders / nominees owning more than 3% of share capital (as at 31 December 2025)
Name | Number of shares | Percentage of share capital (in %) |
|---|---|---|
| BURU Holding AG / Philipp Buhofer | 1,869,416 | 10.1 |
| UBS Fund Management (Switzerland) AG | 931,146 | 5.0 |
| Dimensional Holdings Inc. | 653,889 | 3.5 |
| JPMorgan Chase & Co. | 600,840 | 3.3 |
| BlackRock, Inc. | 565,243 | 3.0 |
Coverage of Implenia’s shares
Investment specialists continuously analyse Implenia’s business performance, results and market situation. Seven analysts regularly publish studies on Implenia's shares.
| Broker / Bank | Rating |
|---|---|
| Berenberg | Hold |
| Kepler Cheuvreux | Buy |
| ODDO BHF | Outperform |
| Research Partners | Hold |
| St. Galler Kantonalbank | Neutral |
| UBS | Buy |
| Zürcher Kantonalbank | Market weightings |
As at: 20.1.2026
Credit ratings
Implenia Ltd. has no official credit rating from a credit rating agency. The listed ratings are based on each bank’s internal criteria. Please note that credit ratings can change at any time.
| Rating agency / bank | Rating | Outlook |
|---|---|---|
| UBS | BBB- | Stable |
| Zürcher Kantonalbank | BB+ | Positive |
| Fedafin | Not disclosed | Not disclosed |
| Independent Credit View | Not disclosed | Not disclosed |
As at: 20.1.2026
Outstanding bonds
Implenia has issued the following CHF bonds and listed them on SIX Swiss Exchange. The bond that expires in 2026 was refinanced early in September 2025 and will be repaid in March 2026.
| Coupon | Term | Nominal | Issue price | Due | ISIN-Code |
|---|---|---|---|---|---|
| 1.00% | 2016–2026 | CHF 125 Mio. | 100.740% | 20.3.2026 | CH031 699 4661 |
| 3.00% | 2024–2028 | CHF 175 Mio. | 100.000% | 17.5.2028 | CH134 431 6687 |
| 2.50% | 2025–2029 | CHF 220 Mio. | 100.000% | 30.4.2029 | CH142 886 7134 |
| 2.05% | 2025–2030 | CHF 200 Mio. | 100.082% | 3.10.2030 | CH148 582 7047 |
Syndicated loan agreement
Implenia also has a revolving syndicated loan agreement for CHF 650 million, which in November 2022 was extended to December 2027. This unsecured credit facility consists of a tranche of CHF 100 million (Facility A) as a revolving cash limit, a guarantee limit of CHF 250 million (Facility B), and a cash and / or guarantee limit of CHF 300 million (Facility C). As of the balance sheet date, all cash-available portions of the credit facility were unused and available.

| in TCHF | 2025 | 2024 | 2023 | 2022 | 2021 |
|---|---|---|---|---|---|
| Order book (as at 31.12.) | 8,467,385 | 6,788,275 | 6,985,442 | 7,221,306 | 6,880,921 |
| Income statement | |||||
| Production output | 4,103,948 | 4,293,651 | 4,203,874 | 4,152,567 | 4,174,113 |
| Group revenue | 3,474,545 | 3,558,912 | 3,595,909 | 3,538,344 | 3,764,670 |
| EBIT | 140,457 | 130,477 | 122,620 | 138,861 | 114,826 |
| Consolidated profit | 84,650 | 93,351 | 141,757 | 105,963 | 63,956 |
| Cash flow statement | |||||
| Cash flow from operating activities | 137,287 | 43,158 | (30,371) | 128,126 | (69,246) |
| Cash flow from investment activities | (136,943) | (96,714) | 17,712 | (4,129) | 51,752 |
| Cash flow from financing activities | 131,256 | (23,908) | (99,079) | (294,335) | 107,425 |
| Free Cash Flow1 | 125,344 | (53,556) | (12,659) | 123,997 | (17,494) |
| Investment activities | |||||
| Investments in real estate transactions | 45,981 | 65,153 | 37,832 | 19,915 | 41,078 |
| Disposals of real estate operations | (46,852) | (33,339) | (31,163) | (26,655) | (28,351) |
| Investments in property, plant and equipment | 42,390 | 69,045 | 51,641 | 44,238 | 42,653 |
1 2022: Excl. release of short-term fixed deposits before redemption of convertible bond.
Balance sheet
| in TCHF | 31.12.2025 | 31.12.2024 | 31.12.2023 | 31.12.2022 | 31.12.2021 |
|---|---|---|---|---|---|
| Cash and short-term fixed deposits | 658,014 | 401,995 | 478,809 | 609,040 | 796,895 |
| Real estate transactions | 190,135 | 190,680 | 149,136 | 141,026 | 149,269 |
| Other current assets | 1,301,919 | 1,293,504 | 1,102,142 | 1,084,524 | 1,136,534 |
| Fixed assets | 1,176,831 | 1,212,252 | 1,175,454 | 918,836 | 905,138 |
| Total assets | 3,326,899 | 3,098,431 | 2,905,541 | 2,753,426 | 2,987,836 |
| Financial liabilities | 882,085 | 686,600 | 710,900 | 654,479 | 888,453 |
| Other liabilities | 1,691,524 | 1,755,162 | 1,618,866 | 1,616,277 | 1,753,465 |
| Shareholders’ equity | 753,290 | 656,669 | 575,775 | 482,670 | 345,918 |
| Total liabilities | 3,326,899 | 3,098,431 | 2,905,541 | 2,753,426 | 2,987,836 |
| Net cash position excl. liabilities from leasing | (69,627) | (113,325) | (49,897) | 120,336 | 67,319 |
| Capital structure | |||||
| Equity ratio in %1 | 23.5 | 21.2 | 19.8 | 17.5 | 11.6 |
| Long-term liabilities in % | 25.0 | 18.0 | 20.4 | 24.4 | 25.2 |
| Short-term liabilities in % | 52.4 | 60.8 | 59.8 | 58.1 | 63.2 |
| Employees (FTE; as of 31.12.)2 | 8,346 | 9,046 | 9,056 | 7,639 | 7,653 |
1 2025: Adjusted for short-term fixed-term deposits; 2021: Incl. subordinated convertible bond
2 Excl. temporary employees.
Implenia Group five-year overview
| 2025 | 2024 | 2023 | 2022 | 2022 | |
|---|---|---|---|---|---|
| Key figures | |||||
| EBIT margin in %1 | 4.0 | 3.7 | 3.4 | 3.9 | 3.1 |
| Return on invested capital (ROIC) in % | 18.0 | 18.4 | 24.0 | 40.6 | 48.7 |
1 Basis: Group revenue IFRS.
Overview of sustainability ratings and standards
| Ratings | Score | Evaluation period | Rang |
|---|---|---|---|
| MSCI | AAA / AAA | 2024 | «Leader» |
| Sustainalytics ESG Rating | 88 / 100 | 2024 | 1 |
| Sustainalytics ESG Risk Rating | 28.4 / 100 | 2024 | 11th percentile |
| EcoVadis | Silver (75 / 100) | 2024 | 7th percentile |
| Inrate | B / A+ | 2024 | – |
| CDP | B / A | 2024 | – |
You can read more about sustainable investment in the Sustainability Report.