Key Figures for the Group
Consolidated key figures
| in TCHF | 2025 | 2024 | Δ | Δ like-for-like1 |
|---|---|---|---|---|
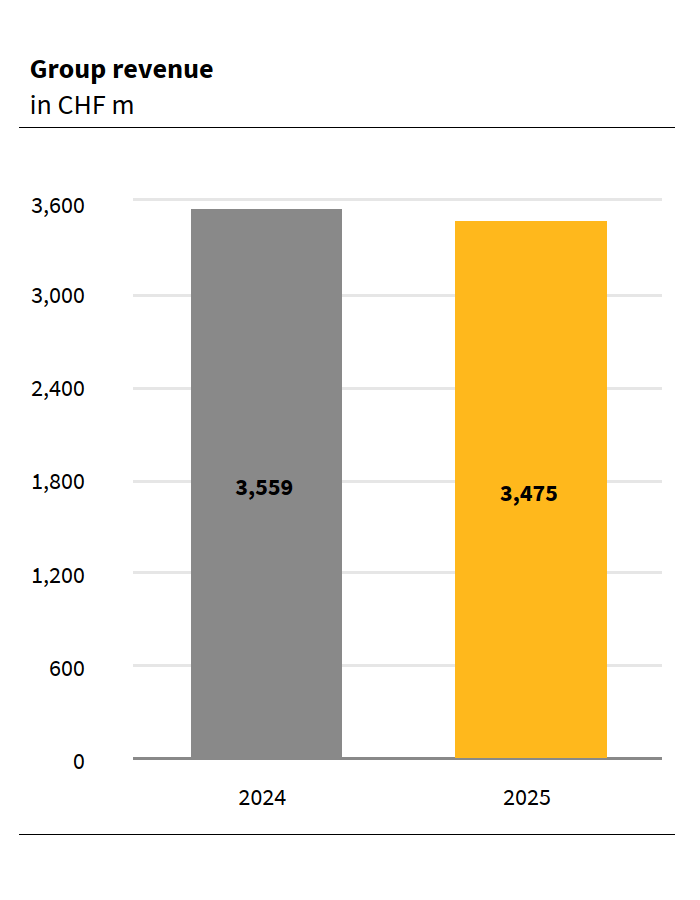
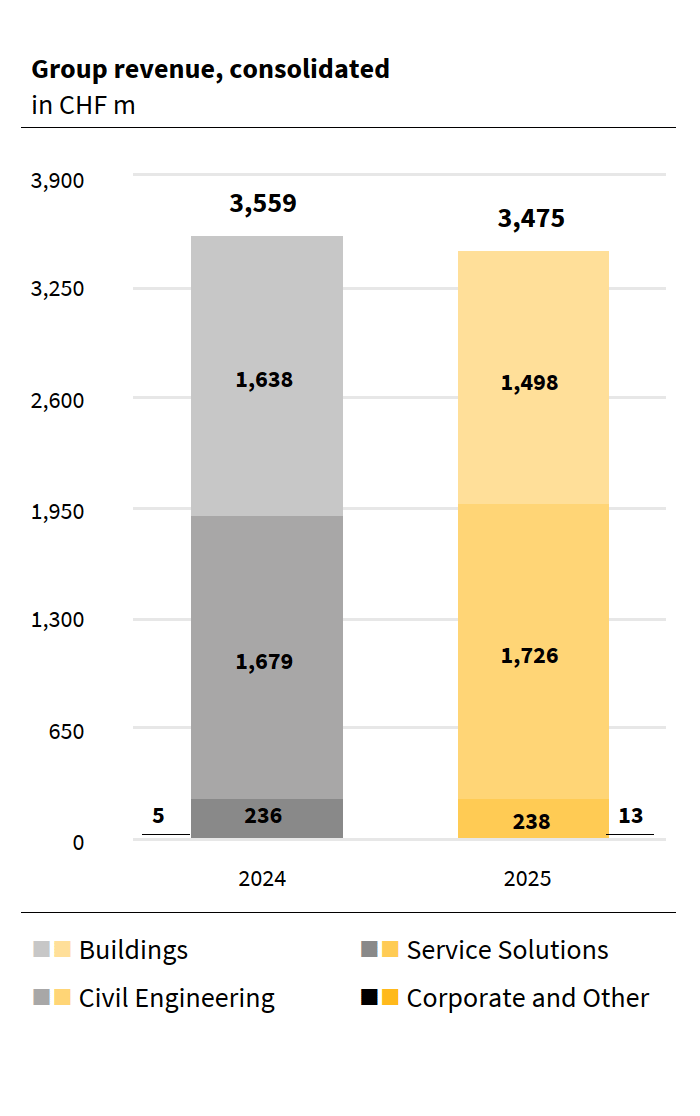
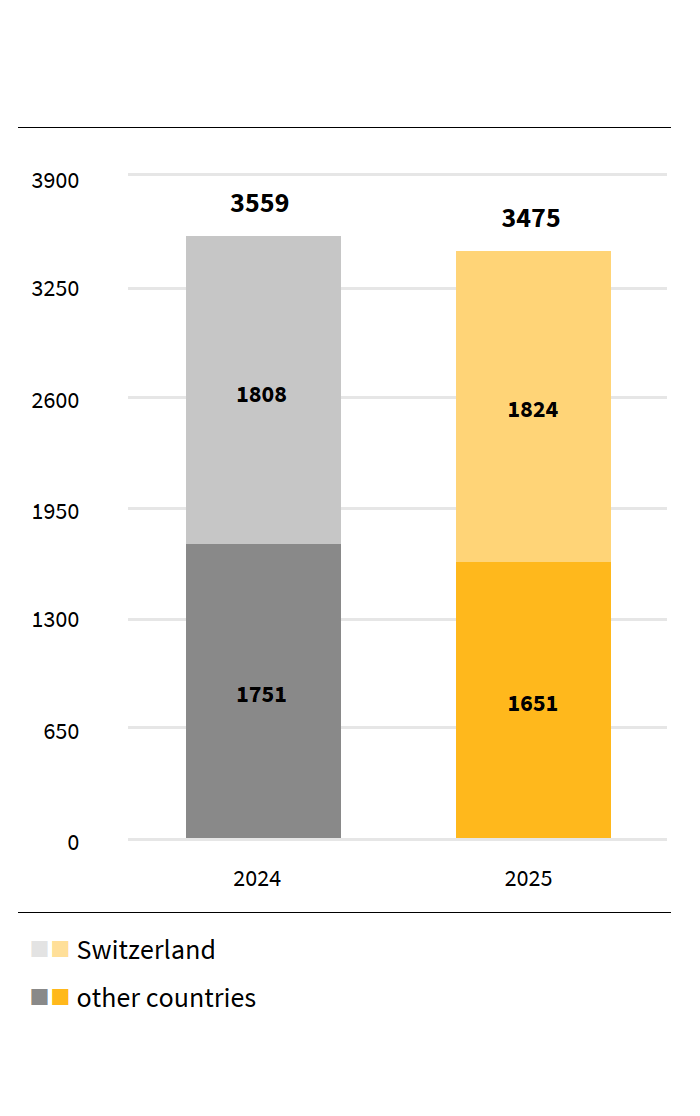
| Group revenue | 3,474,545 | 3,558,912 | (2.4%) | (1.8%) |
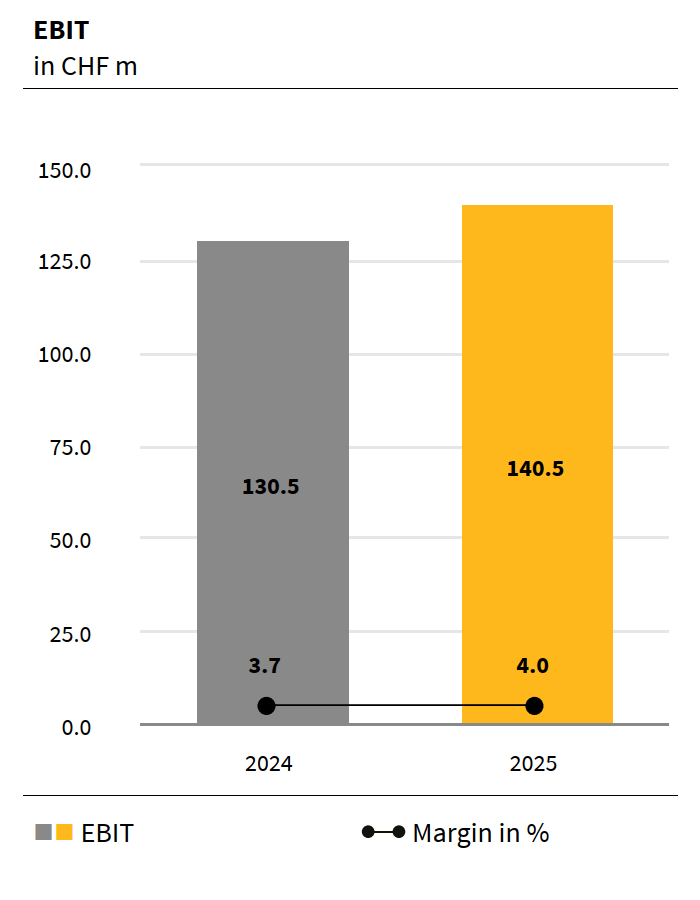
| EBIT | 140,457 | 130,477 | ||
| in % of Group revenue | 4.0 | 3.7 | ||
| Consolidated profit | 84,650 | 93,351 | ||
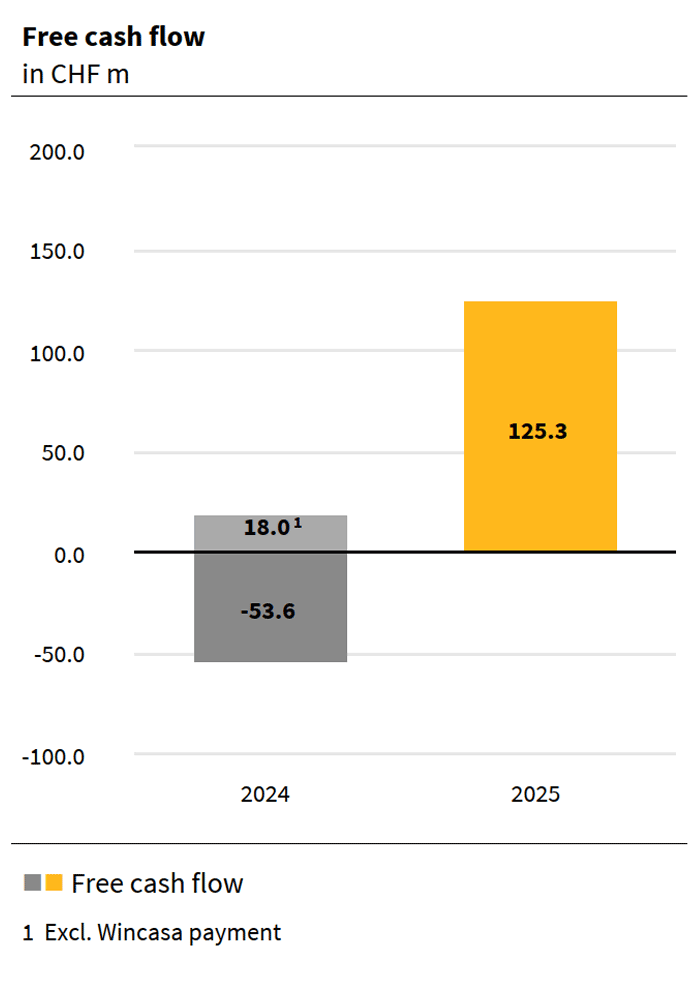
| Free cash flow | 125,344 | (53,556) | ||
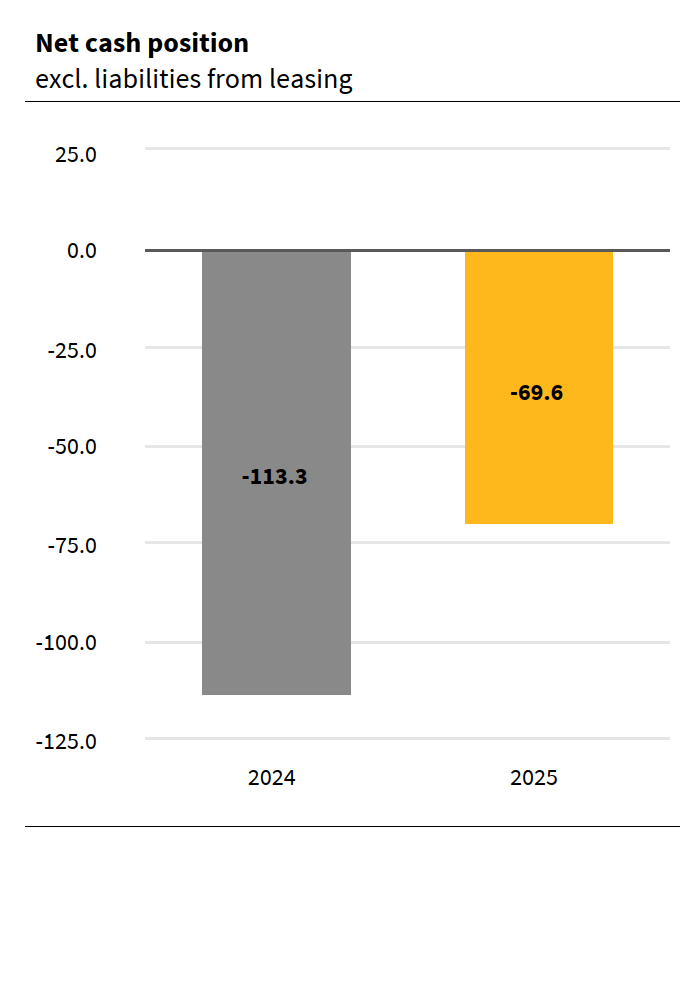
| Net cash position excl. liabilities from leasing (as at 31.12.) | (69,627) | (113,325) | 38.6% | 39.4% |
| Net cash position (as at 31.12.) | (224,071) | (284,605) | 21.3% | 21.4% |
| Equity (as at 31.12.) | 753,290 | 656,669 | 14.7% | 15.5% |
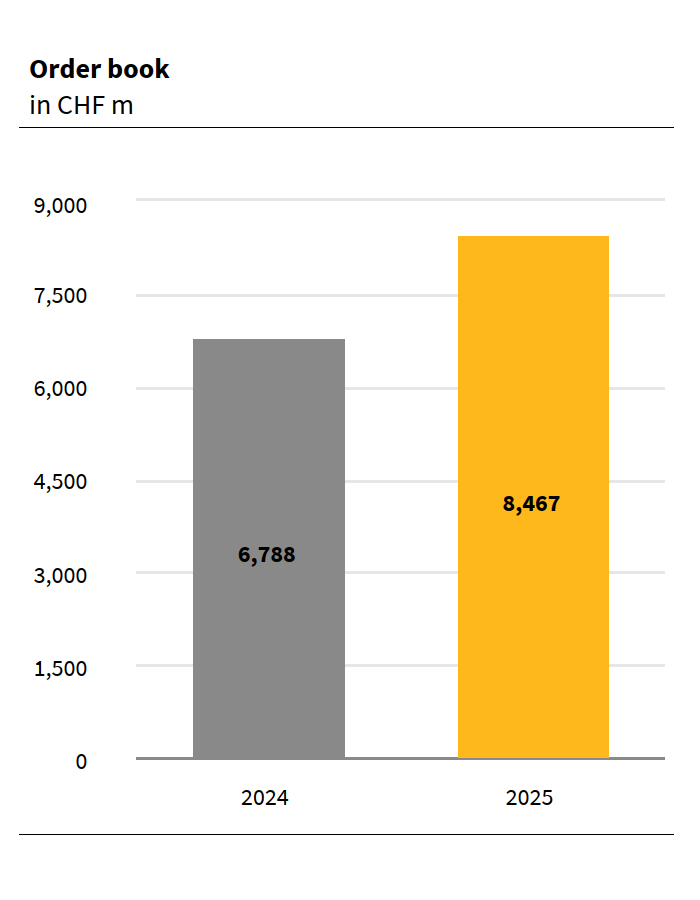
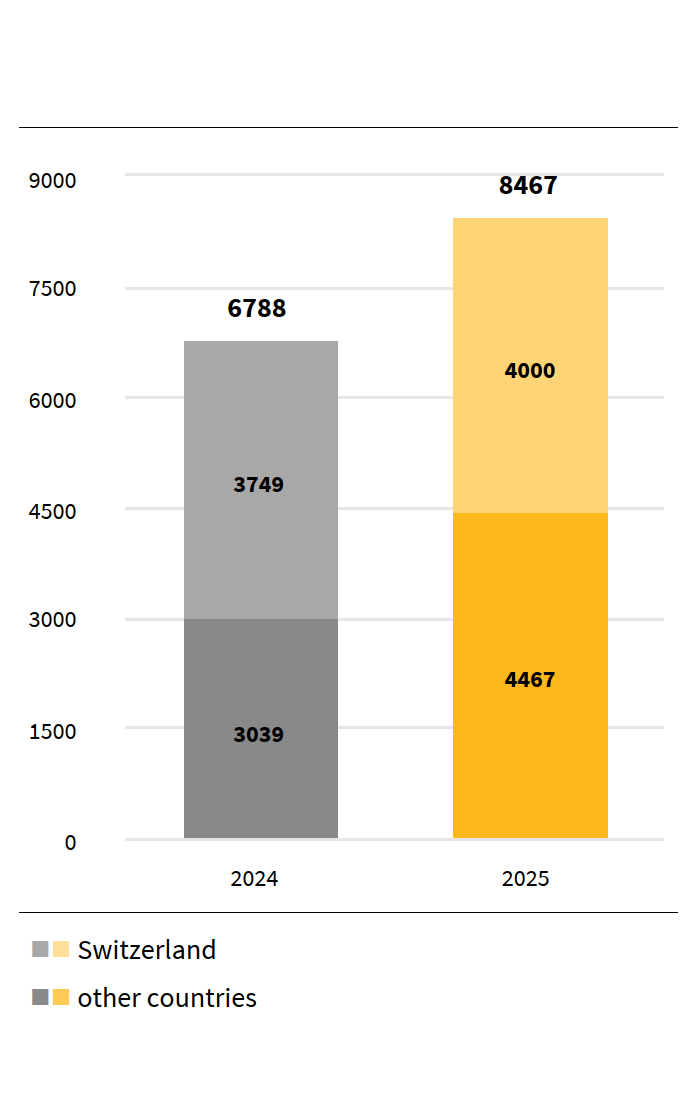
| Order book (as at 31.12.) | 8,467,385 | 6,788,275 | 24.7% | 26.0% |
| Production output | 4,103,948 | 4,293,651 | (4.4%) | (3.8%) |
| Employees (FTE; as of 31.12.) | 8,346 | 9,046 | (7.7%) |
1 Foreign currency adjusted
Operating profit (EBIT) improves to CHF 140.5 million, order book reaches CHF 8.5 billion for the first time
Implenia achieved EBIT of CHF 140.5 million (2024: CHF 130.5 million). The EBIT margin increased to 4.0% (2024: 3.7%). Group revenue declined slightly to CHF 3,475 million (2024: CHF 3,559 million). The order book went up to CHF 8,467 million (2024: CHF 6,788 million), which corresponds to growth of 24.7%. This should lead to an increase in revenue from 2027 onwards. The pre-calculated project margin of the order book improved from 7.3% at the end of 2024 to 7.8%.
The consolidated profit amounted to CHF 84.7 million (2024: CHF 93.4 million). This development was influenced by higher financing costs – due, among other things, to early refinancing- and one-off tax effects in previous years. Earnings before taxes rose to CHF 109.2 million (2024: CHF 106.4 million).
Free cash flow rises to CHF 125.3 million, equity ratio reaches 23.5%
Free cash flow rose significantly by CHF 179 million to CHF 125.3 million (2024: CHF 18.0 million, excluding the second tranche of the payment for Wincasa; reported: CHF -53.6 million). As of 31 December 2025, all syndicated credit limits totalling CHF 400 million were available to the company alongside other bilateral credit lines. Equity increased by CHF 96.6 million to CHF 753.3 million (2024: CHF 656.7 million). As at 31 December 2025, the equity ratio had risen to 23.5% (2024: 21.2%), adjusted for time deposits from the early refinancing of the bond expiring in March 2026. The reported equity ratio was 22.6% accordingly. In addition to good operating results, the surplus in the Implenia pension fund contributed to this positive development. Total assets rose slightly to CHF 3,202 million (excluding short-term time deposits from the proceeds of the bond issuance in April; 2024: CHF 3,098 million).
EBIT forecast of CHF ~150 million (excl. growth investments) for 2026, further increase from 2027 onwards
Implenia expects EBIT of CHF ~150 million for the full year 2026, excluding extraordinary growth investments of CHF 10-20 million for strategy implementation. In helping to develop capabilities and expertise, these investments will enhance differentiation and specialisation in the three Divisions. This also includes further optimising specific areas of the organisation, focusing them on future success. As mid-term visibility and the order book’s pre-calculated project margin have continued to improve, Implenia expects a further increase in EBIT from 2027 onwards compared to CHF ~150 million in 2026. Mid-term financial targets remain unchanged, with an equity ratio of 25% and EBIT margin of >4.5%.
Implenia, with its differentiated range of services, is benefitting from the megatrends of population growth and urbanisation, energy transition and sustainability, digitalisation and industrialisation. Forecasts for the relevant market segments in Switzerland, Germany and Europe are positive. Infrastructure and defence programmes are significantly increasing construction expenditure in European markets. Implenia specialises and is experienced in these areas. The current low level of interest rates is also encouraging growth in the building construction sector. To take advantage of these opportunities, Implenia is implementing a growth and differentiation strategy. This will enable the Group to gradually increase revenue from 2027 onwards while further improving its EBIT margin and free cash flow.
Balance sheet key figures
| in TCHF | 31.12.2025 | 31.12.2024 | Δ |
|---|---|---|---|
| Cash and short-term fixed deposits | 658,014 | 401,995 | 63.7% |
| Real estate transactions | 190,135 | 190,680 | (0.3%) |
| Other current assets | 1,301,919 | 1,293,504 | 0.7% |
| Fixed assets | 1,176,831 | 1,212,252 | (2.9%) |
| Total assets | 3,326,899 | 3,098,431 | 7.4% |
| Financial liabilities | 882,085 | 686,600 | 28.5% |
| Other liabilities | 1,691,524 | 1,755,162 | (3.6%) |
| Shareholders’ equity | 753,290 | 656,669 | 14.7% |
| Total liabilities | 3,326,899 | 3,098,431 | 7.4% |
| Net cash position excl. liabilities from leasing | (69,627) | (113,325) | 38.6% |
| Investments in real estate transactions | 45,981 | 65,153 | (29.4%) |
| Investments in property, plant and equipment | 42,390 | 69,045 | (38.6%) |
| Equity ratio1 in % | 23.5 | 21.2 |
1 Adjusted for short-term time deposits
EBIT
| in TCHF | 2025 | 2024 | Δ |
|---|---|---|---|
| Buildings | 75,635 | 75,022 | 0.8% |
| Civil Engineering | 55,016 | 48,170 | 14.2% |
| Service Solutions | 20,533 | 17,864 | 14.9% |
| Corporate and Other | (10,727) | (10,579) | 1.4% |
| Total EBIT | 140,457 | 130,477 | 7.6% |
The previous year's figures were adjusted to reflect the new organisational structure as of 1 April 2025.
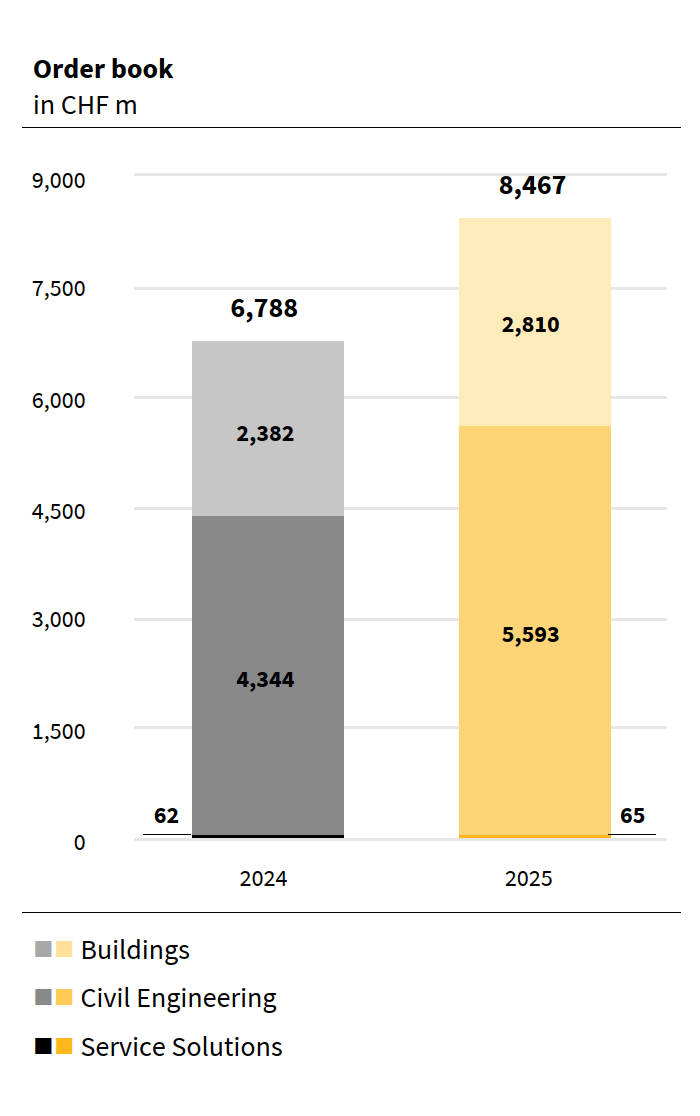
Order book
| in TCHF | 31.12.2025 | 31.12.2024 | Δ |
|---|---|---|---|
| Buildings | 2,809,936 | 2,382,217 | 18.0% |
| Civil Engineering | 5,592,742 | 4,343,821 | 28.8% |
| Service Solutions | 64,707 | 62,237 | 4.0% |
| Total orders | 8,467,385 | 6,788,275 | 24.7% |
Group revenue
| in TCHF | 2025 | 2024 | Δ |
|---|---|---|---|
| Buildings | 1,497,896 | 1,638,468 | (8.6%) |
| Civil Engineering | 1,725,987 | 1,679,372 | 2.8% |
| Service Solutions | 237,693 | 236,078 | 0.7% |
| Corporate and Other / elimination of internal revenue | 12,969 | 4,994 | 159.7% |
| Total Group revenue (consolidated) | 3,474,545 | 3,558,912 | (2.4%) |
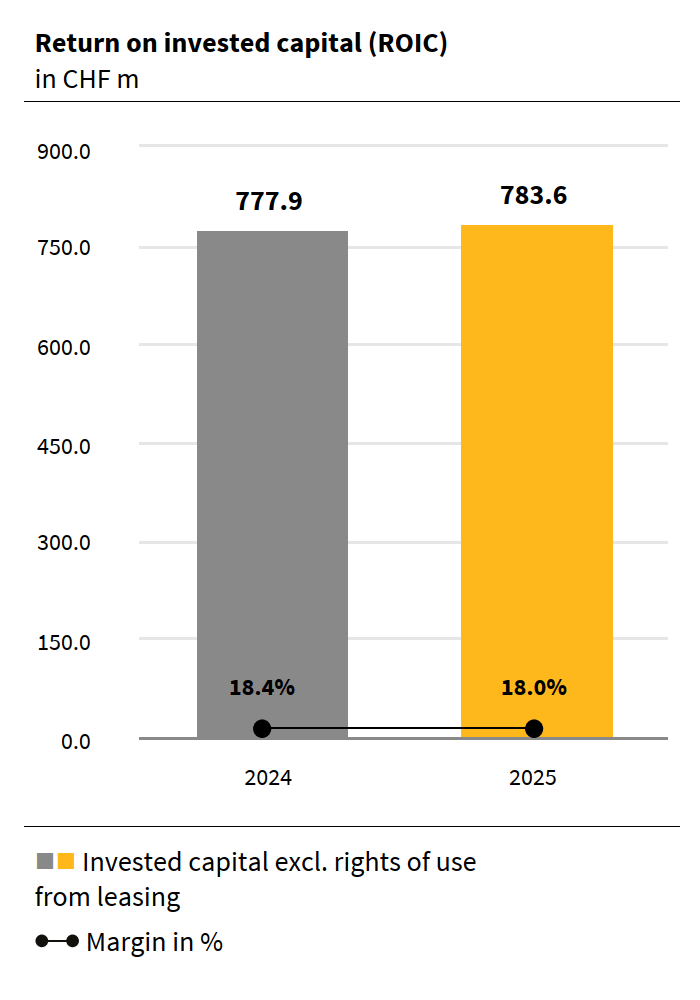
Invested capital
| in TCHF | 31.12.2025 | 31.12.2024 | Δ |
|---|---|---|---|
| Current assets (excl. cash and short-term time deposits) | 1,492,054 | 1,484,184 | 0.5% |
| Fixed assets (excluding retirement assets and rights of use from leasing) | 977,362 | 1,042,489 | (6.2%) |
| Debt (excluding financial liabilities and pension liabilities) | (1,685,837) | (1,748,725) | (3.6%) |
| Total invested capital excl. rights of use from leasing | 783,579 | 777,948 | 0.7% |
| Rights of use from leasing | 147,154 | 162,557 | (9.5%) |
| Total invested capital | 930,733 | 940,505 | (1.0%) |