Share and financing
1 Subject to approval by Annual General Meeting of Shareholders
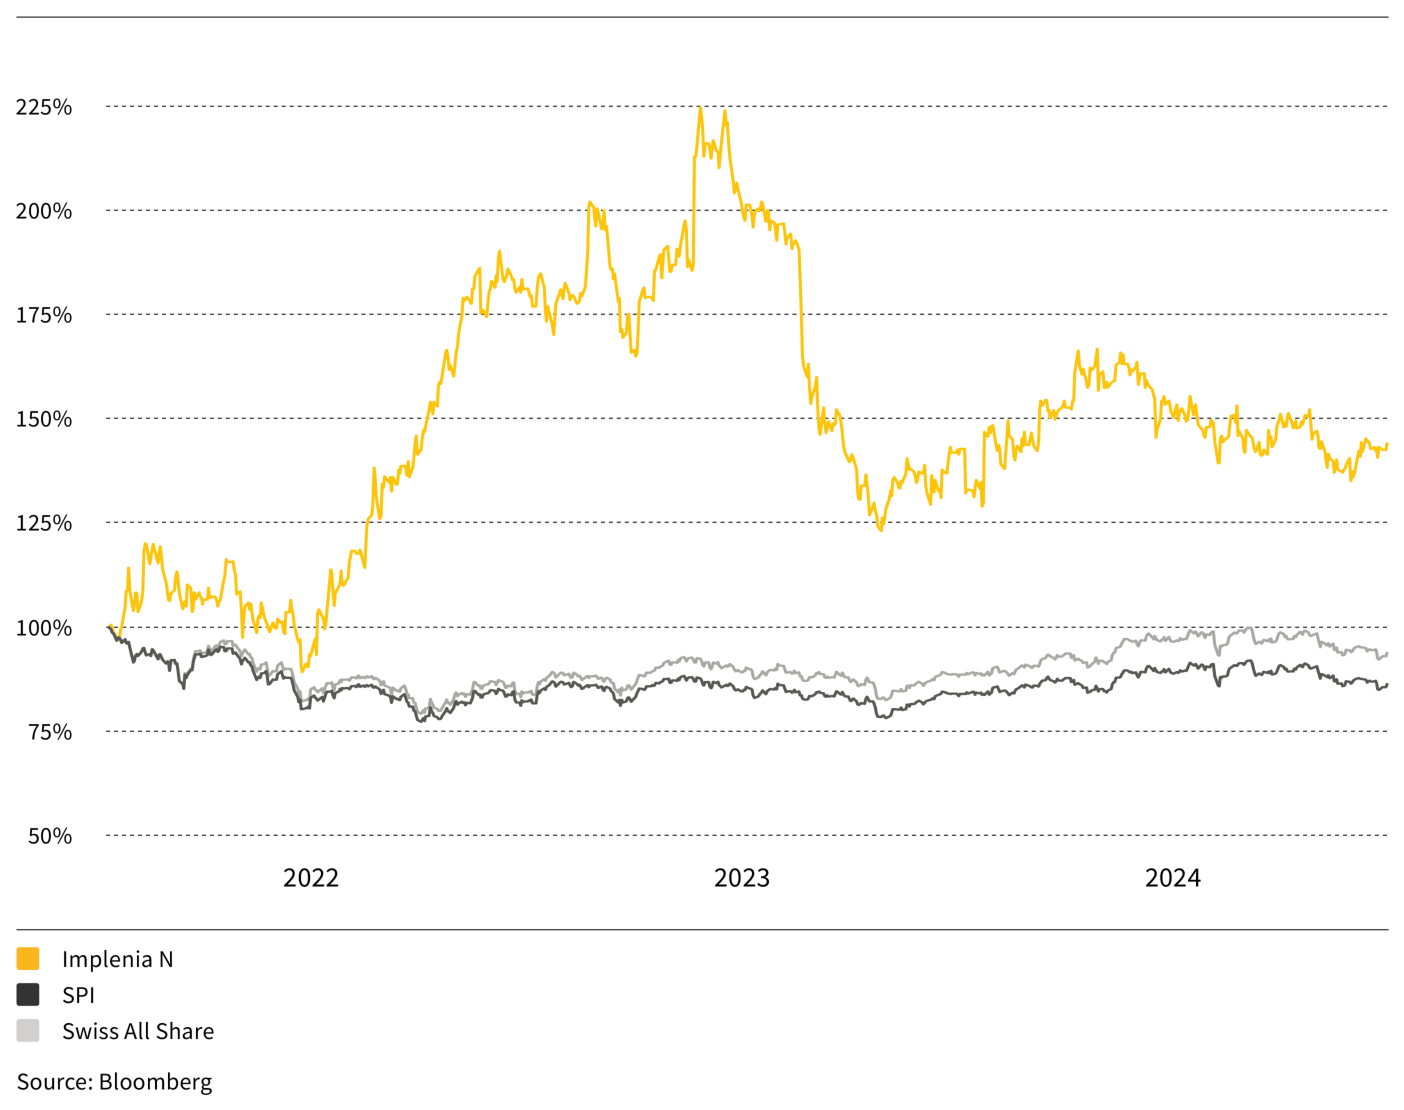
Share price since 1 January 2022 (indexed)
Total shareholder return +49.8%
Information about Implenia's shares
Review
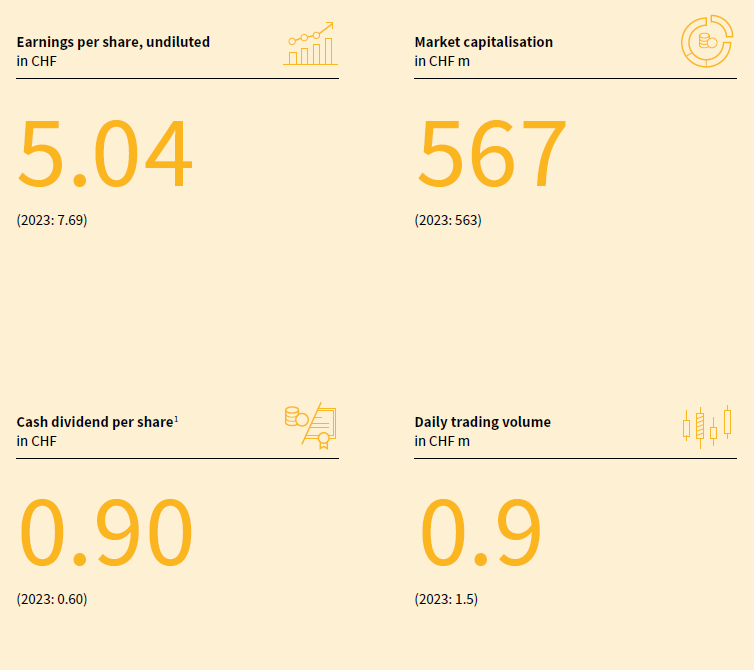
The average number of shares traded each day fell to approximately 29,000 in 2024, compared with approx. 41,700 in the previous year. The average daily trading volume fell to CHF 0.9 million (from CHF 1.5 million in 2023). Implenia's closing price at the end of 2024 was CHF 30.70 (closing price 2023: CHF 30.50), an increase of 0.7%.
Share performance | ||||||||||
2024 | 2023 | 2022 | 2021 | 2020 | ||||||
High (in CHF per share) | 36.80 | 48.60 | 41.45 | 30.88 | 46.25 | |||||
Low (in CHF per share) | 27.10 | 25.75 | 18.40 | 17.81 | 16.79 | |||||
Price at 31.12. (in CHF per share) | 30.70 | 30.50 | 38.05 | 20.76 | 24.04 | |||||
Annual performance | 0.7% | (19.8%) | 83.3% | (13.6%) | 30.0% | |||||
Average number of shares traded per day | 28,525 | 41,683 | 40,541 | 42,545 | 90,846 | |||||
Market capitalisation as of 31.12. (In TCHF) | 567,090 | 563,396 | 702,860 | 383,479 | 444,067 |
Source: Bloomberg
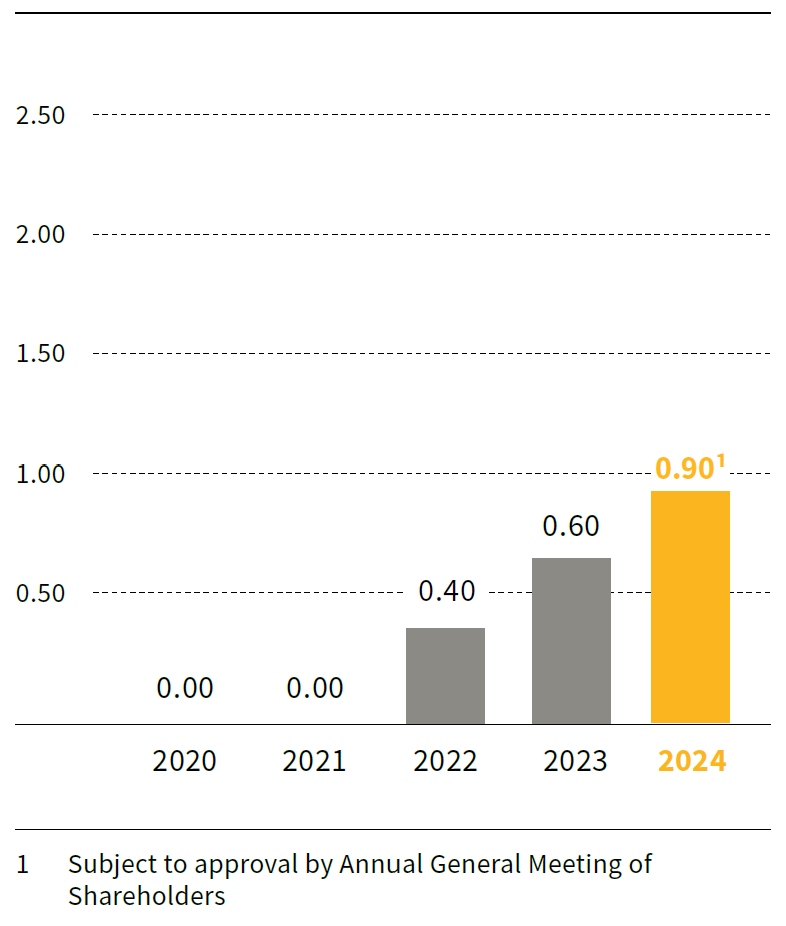
Cash dividend
in CHF per share
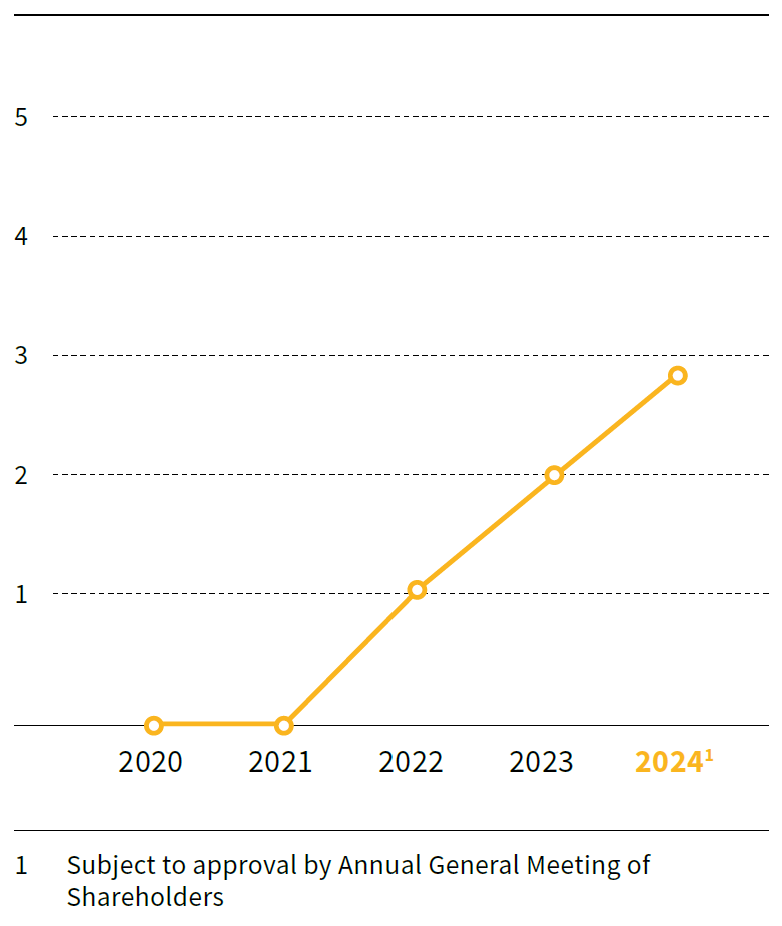
Dividend yield
in %
Dividend policy and returns
Board of Directors will propose a dividend of CHF 0.90 per share to Annual General Meeting
Implenia wants its shareholders to participate in the company's growing success, so the Board of Directors will propose a dividend of CHF 0.90 per share (previous year: CHF 0.60) to the Annual General Meeting of Shareholders on 25 March 2025. The Board of Directors anticipates that Implenia will continue to distribute dividends in future years.
Key data
Symbol | IMPN | |
Securities no. | 2,386,855 | |
ISIN | CH002 386 8554 |
Index membership
- SPI
- SPI ESG
- SPI ESG Select
- SPI ex SLI
- SPI EXTRA
- Swiss All Share
Share capital | ||||||||||
31.12.2024 | 31.12.2023 | 31.12.2022 | 31.12.2021 | 31.12.2020 | ||||||
Share capital (in TCHF) | 18,841 | 18,841 | 18,841 | 18,841 | 18,841 | |||||
Number of registered | 18,472,000 | 18,472,000 | 18,472,000 | 18,472,000 | 18,472,000 | |||||
Of which treasury shares | 85,697 | 264,172 | 64,954 | 63,854 | 29,404 | |||||
Number of outstanding | 18,386,303 | 18,207,828 | 18,407,046 | 18,408,146 | 18,442,596 | |||||
Par value of each | 1.02 | 1.02 | 1.02 | 1.02 | 1.02 | |||||
Conditional / Authorised capital | 0 | 3,768 | 3,768 | 3,768 | 3,768 |
Key figures | ||||||||||
31.12.2024 | 31.12.2023 | 31.12.2022 | 31.12.2021 | 31.12.2020 | ||||||
Earnings per share (in CHF) | 5.04 | 7.69 | 5.68 | 3.31 | (7.30) | |||||
Price-earnings ratio | 6.1 | 4.0 | 6.7 | 6.0 | (3.3) | |||||
Equity per share (in CHF) | 35.55 | 31.17 | 26.13 | 18.73 | 16.40 | |||||
Gross dividend1 (in CHF) | 0.90 | 0.60 | 0.40 | - | - | |||||
Dividend yield | 2.9 % | 2.0 % | 1.1 % | 0.0 % | 0.0 % | |||||
Distribution ratio | 17.9 % | 7.8 % | 7.0 % | 0.0 % | 0.0 % |
1 2024: subject to approval by the Annual General Meeting
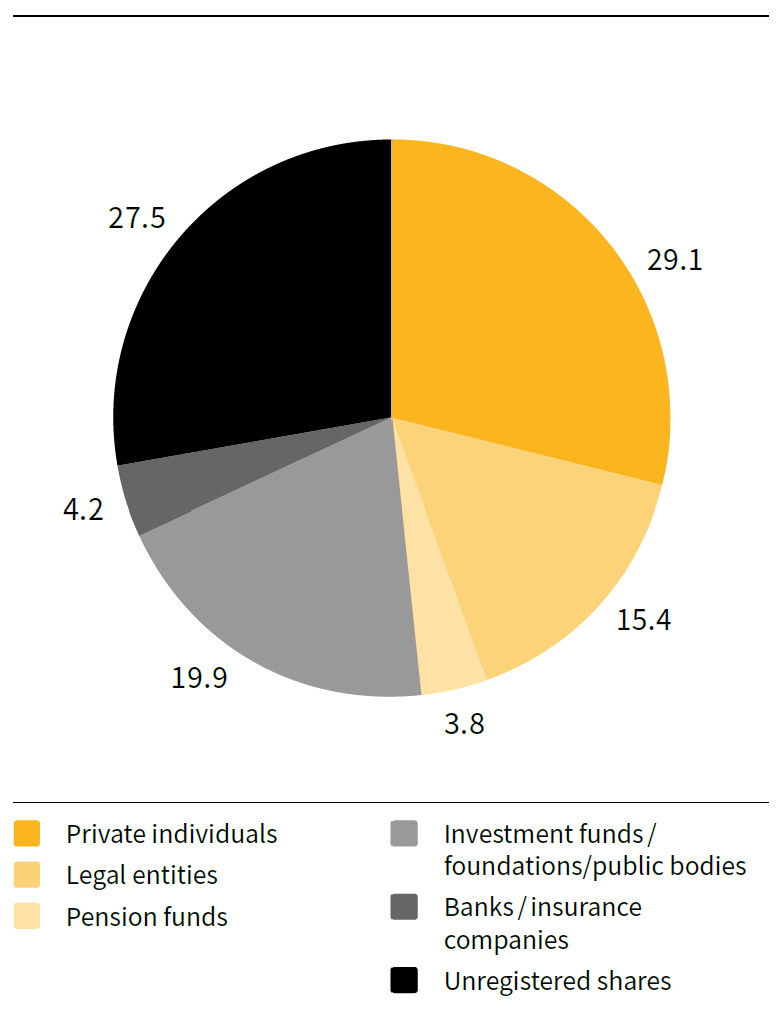
Share capital by type of shareholder
(shares with and without voting rights) in %
as at 31 December 2024
Shareholders by size of shareholding
(shares with and without voting rights) in %
as at 31 December 2024

Shareholder structure
Major shareholders/nominees owning more than 3% of share capital (as at 31 December 2024) | ||||
Name | Number of shares | Percentage of share capital | ||
BURU Holding AG / Philipp Buhofer | 2,535,500 | 13.7% | ||
Rudolf Maag | 1,000,000 | 5.4% | ||
UBS Fund Management (Switzerland) AG | 929,558 | 5.0% | ||
Dimensional Holdings Inc. | 653,889 | 3.5% | ||
Fund Partners Solutions (Suisse) SA | 557,362 | 3.0% | ||
Swisscanto Fondsleitung AG | 555,072 | 3.0% | ||
Analyst recommendations
Coverage of Implenia's shares
Investment specialists continuously analyse Implenia's business performance, results and market situation. Six analysts regularly publish studies on Implenia's shares.
| Broker/bank | Rating | |
| Kepler Cheuvreux | Buy | |
| ODDO BHF | Outperform | |
| Research Partners | Hold | |
| St. Galler Kantonalbank | Opportunity | |
| UBS | Buy | |
| Zürcher Kantonalbank | Market weightings | |
As at: 15.1.2025 | ||
Credit ratings
Implenia Ltd. has no official credit rating from a credit rating agency. The listed ratings are based on each bank's internal criteria. Please note that credit ratings can change at any time.
| Rating agency/bank | Rating | Outlook | ||
| UBS | BB+ | Positive | ||
| Zürcher Kantonalbank | BB+ | Stable | ||
| Fedafin | Not disclosed | Not disclosed | ||
| Independent Credit View | Not disclosed | Not disclosed | ||
As at: 15.1.2025 | ||||
Debt financing
Outstanding bonds
Implenia has issued the following CHF bonds and listed them on the SIX Swiss Exchange.
| Coupon | Term | Nominal | Issue price | Due | ISIN code | |||||
| 1.000% | 2016-2026 | CHF 125 m | 100.74% | 20.3.2026 | CH031 699 4661 | |||||
| 2.000% | 2021-2025 | CHF 175 m | 100.00% | 26.11.2025 | CH114 509 6173 | |||||
| 3.000% | 2024-2028 | CHF 175 m | 100.00% | 17.5.2028 | CH134 431 6687 |
Outstanding promissory note loans
In June 2017, Implenia issued a promissory note loan (private placement), for a total amount of EUR 60 million. The three EUR-denominated tranches have fixed interest rates and maturities of four, six and eight years. The first tranche of EUR 10 million was repaid in 2021 and the second tranche of EUR 20 million in 2023.
| Coupon | Term | Nominal | Due | |||
| Fixed | 2017-2025 | EUR 30 m | 9.6.2025 |
Syndicated loan agreement
Implenia has a revolving syndicated loan agreement for CHF 650 million, which in November 2022 was extended to December 2027. This unsecured credit facility consists of a tranche of CHF 100 million (Facility A) as a revolving cash limit, a guarantee limit of CHF 450 million (Facility B), and a cash and / or guarantee limit of CHF 100 million (Facility C). As of the balance sheet date, no liquidity had been drawn down from the usable portion of the credit facility.
Maturity profile of debt financing instruments
as at 31.12.2024

Overview of key figures
Five-year Implenia Group overview | ||||||||||
in TCHF | 2024 | 2023 | 2022 | 2021 | 2020 | |||||
Order book (as at 31.12.) | 6,788,275 | 6,985,442 | 7,221,306 | 6,880,921 | 6,386,284 | |||||
Income statement | ||||||||||
Production output | 4,293,651 | 4,203,874 | 4,152,567 | 4,174,113 | 4,060,298 | |||||
Consolidated revenue | 3,558,912 | 3,595,909 | 3,538,344 | 3,764,670 | 3,988,946 | |||||
EBIT | 130,477 | 122,620 | 138,861 | 114,826 | (146,757) | |||||
Consolidated profit | 93,351 | 141,757 | 105,963 | 63,956 | (132,052) | |||||
Cash flow statement | ||||||||||
Cash flow from operating activities | 43,158 | (30,371) | 128,126 | (69,246) | (161,533) | |||||
Cash flow from investment activities | (96,714) | 17,712 | (4,129) | 51,752 | (31,809) | |||||
Cash flow from financing activities | (23,908) | (99,079) | (294,335) | 107,425 | 4,161 | |||||
Free cash flow1 | (53,556) | (12,659) | 123,997 | (17,494) | (193,342) | |||||
Investment activities | ||||||||||
Investments in real estate transactions | 65,153 | 37,832 | 19,915 | 41,078 | 57,926 | |||||
Real estate disposals | (33,339) | (31,163) | (26,655) | (28,351) | (116,510) | |||||
Investments in fixed assets | 69,045 | 51,641 | 44,238 | 42,653 | 52,106 | |||||
1 Excl. impact of fixed short-term deposit prior to repayment of convertible bond
in TCHF | 31.12.2024 | 31.12.2023 | 31.12.2022 | 31.12.2021 | 31.12.2020 | |||||
Balance sheet | ||||||||||
Cash and cash equivalents | 401,995 | 478,809 | 609,040 | 796,895 | 719,990 | |||||
Real estate transactions | 190,680 | 149,136 | 141,026 | 149,269 | 137,130 | |||||
Other current assets | 1,293,504 | 1,102,142 | 1,084,524 | 1,136,534 | 1,093,712 | |||||
Non-current assets | 1,212,252 | 1,175,454 | 918,836 | 905,138 | 992,379 | |||||
Total assets | 3,098,431 | 2,905,541 | 2,753,426 | 2,987,836 | 2,943,212 | |||||
Financial liabilities | 686,600 | 710,900 | 654,479 | 888,453 | 732,837 | |||||
Other liabilities | 1,755,162 | 1,618,866 | 1,616,277 | 1,753,465 | 1,907,347 | |||||
Equity | 656,669 | 575,775 | 482,670 | 345,918 | 303,027 | |||||
Total equity and liabilities | 3,098,431 | 2,905,541 | 2,753,426 | 2,987,836 | 2,943,211 | |||||
Net cash position | (113,324) | (49,897) | 120,336 | 67,319 | 160,526 | |||||
Capital structure | ||||||||||
Equity ratio | 21.2 % | 19.8 % | 17.5 % | 11.6 % | 10.3 % | |||||
Long-term liabilities | 18.0 % | 20.4 % | 24.4 % | 25.2 % | 24.6 % | |||||
Short-term liabilities | 60.8 % | 59.8 % | 58.1 % | 63.2 % | 65.1 % | |||||
Workforce (FTE; as at 31.12.)1 | 9,046 | 9,056 | 7,639 | 7,653 | 8,701 |
1 Excl. temporary staff
Five-year Implenia Group overview | ||||||||||
in TCHF | 2024 | 2023 | 2022 | 2021 | 2020 | |||||
Key figures | ||||||||||
EBIT margin1 | 3.7 % | 3.4 % | 3.9 % | 3.1 % | (3.7 %) | |||||
Return on Invested Capital (ROIC) | 18.4 % | 24.0 % | 40.6 % | 48.7 % | (82.0 %) |
1 Basis: consolidated revenue IFRS
Sustainable investment
Increasing value through sustainability
Sustainability is an integral part of Implenia's business and value system, which makes Implenia's shares and bonds attractive to those investors who take a sustainable approach to investment.
In 2024 Implenia achieved limited assurance for the first time for key performance indicators such as Scope-1 CO₂ emissions and HR, safety and compliance data.
Certification and ratings
Implenia is certified under the ISO 14001 standard - Environmental Management - and has pursued its own sustainability strategy since 2009. Our sustainability reporting is based on the Global Reporting Initiative (GRI).
A raft of top ratings reflects the external recognition that Implenia's sustained commitment has received in recent years. MSCI ESG - one of the world's leading credit rating agencies - gave Implenia another AAA rating in 2024, for example. EcoVadis, the world's largest provider of sustainability ratings, confirmed Implenia's gold status in 2024. This puts the Group in the top five percent of the more than 100,000 companies evaluated by EcoVadis. Implenia also received above-average sustainability scores from rating companies Morningstar Sustainalytics and Inrate.


The use by Implenia of any MSCI ESG Research LLC or its affiliates ("MSCI") data, and the use of MSCI logos, trademarks, service marks or index names herein, do not constitute a sponsorship, endorsement, recommendation, or promotion of Implenia by MSCI. MSCI services and data are the property of MSCI or its information providers, and are provided "as-is" and without warranty. MSCI names and logos are trademarks or service marks of MSCI.
Overview of sustainability ratings and standards | ||||||
Ratings | Score | Evaluation period | Rank | |||
Sustainalytics ESG Rating | 88 / 100 | 2023 | 1 | |||
Sustainalytics ESG Risk Rating | 26.7 / 100 | 2023 | 8th percentile; | |||
MSCI | AAA / AAA | 2023 | "Leader" | |||
EcoVadis | 75 / 100 | 2023 | 5th percentile | |||
Inrate | B- / A+ | 2023 | - | |||
"Green" credit financing
In 2018 Implenia became the first industrial company in Switzerland to link its credit margin to its sustainability performance. This performance is determined annually by Morningstar Sustainalytics, a leading international provider of ESG ratings. In 2024, Implenia consolidated its leading position - both overall and in the three individual areas - in the "Construction & Engineering" sector, scoring 88 points. This was a two-point improvement on the previous year's rating. Within the sector, Implenia also continues to be an "Industry ESG Top Rated" company in the Morningstar Sustainalytics "ESG Risk Rating". Thanks to its consistent high ratings, Implenia benefits from favourable conditions on the capital market.
Implenia published its new Sustainability Report on 26 February 2025. The Sustainability Report details all the sustainability objectives and activities in all three dimensions - environmental, financial and social.
Communications, contacts and dates
Communications
Implenia follows an open, transparent and timely information policy in the interests of its shareholders, investors and the general public. In its periodic and ad hoc reporting, Implenia is committed to equal treatment of all stakeholder groups with regard to timing and content. Comprehensive information is available to all investors, journalists and interested members of the public on the "Investors" and "Media" pages at implenia.com.
Interested parties can subscribe to all our important corporate communications, including ad hoc press releases, by clicking through to the "Media/News Service" page on the site. As in previous years, in 2024 the CEO, CFO and Investor Relations presented the company at roadshows, conferences and meetings. In 2024 Implenia held its two customary conferences on the financial results - half-year and full-year - for analysts and the media.
Contacts
For ongoing communication with shareholders, investors, journalists and analysts:


Key dates | ||
2025 Annual General Meeting | 25.3.2025 | |
Media and analysts' conference on the 2025 first-half results | 20.8.2025 |