Key Figures for the Group
Consolidated key figures | ||||||||
in TCHF | 2022 | 2021 | Δ | Δ like for like1 | ||||
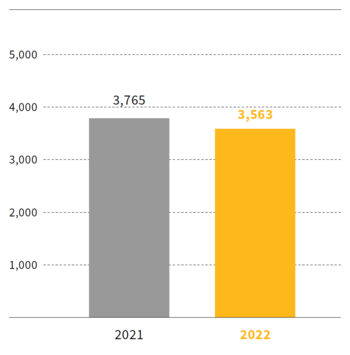
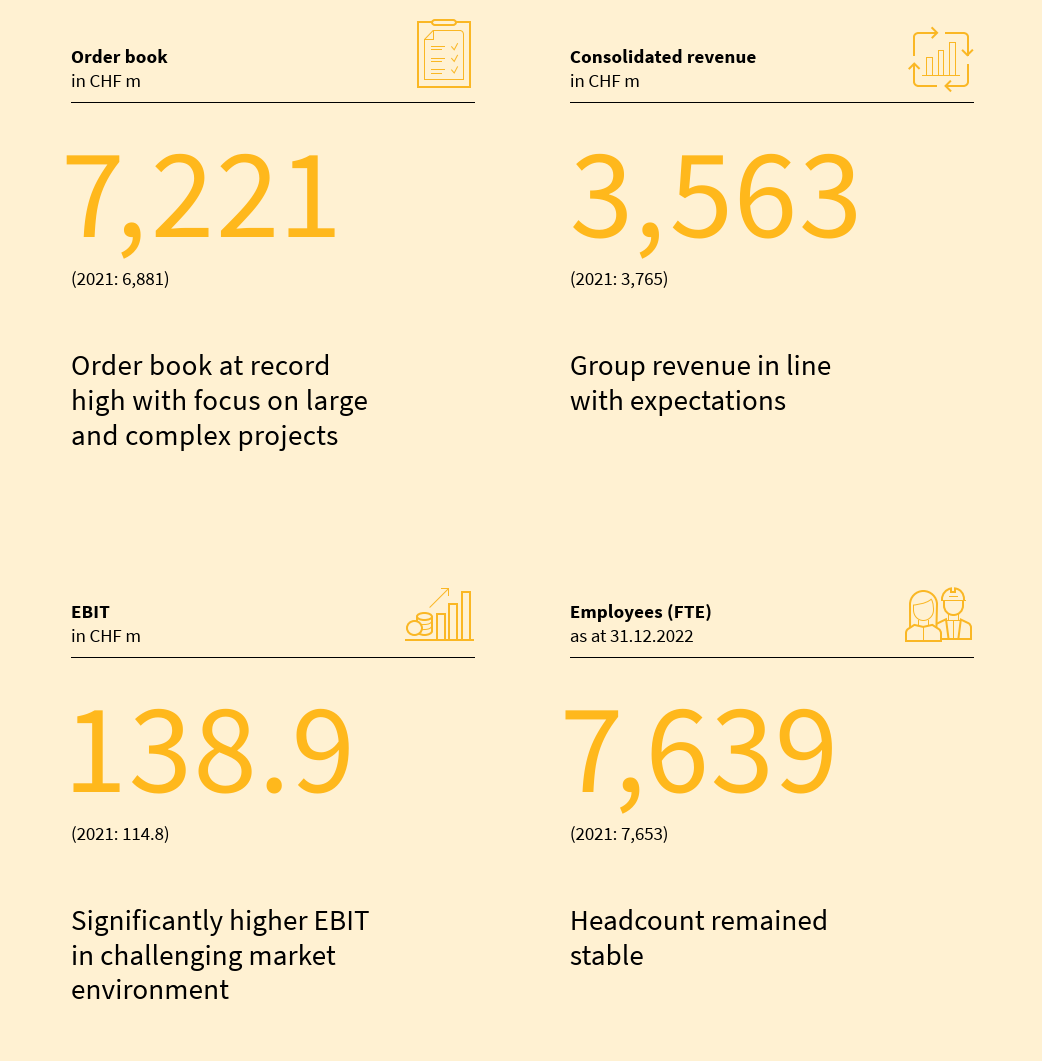
Consolidated revenue | 3,563,266 | 3,764,670 | (5.3 %) | (1.3 %) | ||||
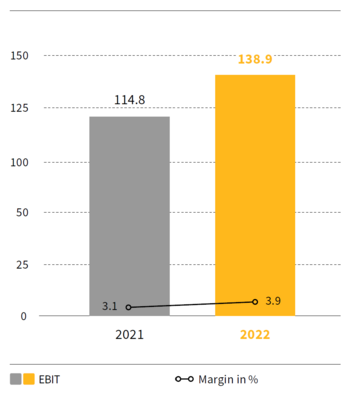
EBIT | 138,861 | 114,826 | ||||||
in % of consolidated revenue | 3.9 % | 3.1 % | ||||||
Consolidated profit | 105,963 | 63,956 | ||||||
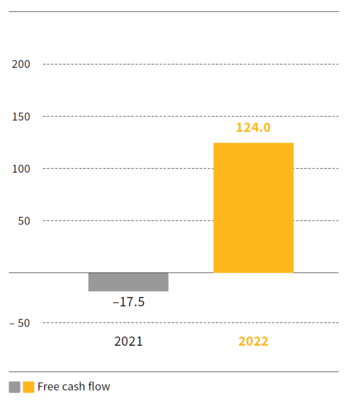
Free cash flow | 123,997 | (17,494) | ||||||
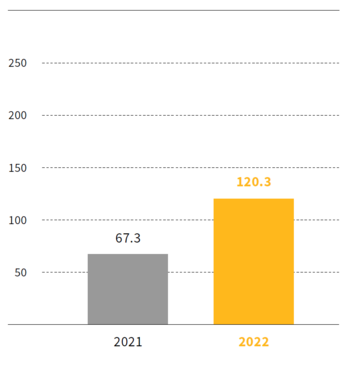
Net cash position excl. lease liabilities (as at 31.12.) | 120,336 | 67,319 | 78.8 % | 104.7 % | ||||
Net cash position (as at 31.12.) | (45,439) | (91,558) | 50.4 % | 62.5 % | ||||
Equity (as at 31.12.) | 482,670 | 345,918 | 39.5 % | 42.8 % | ||||
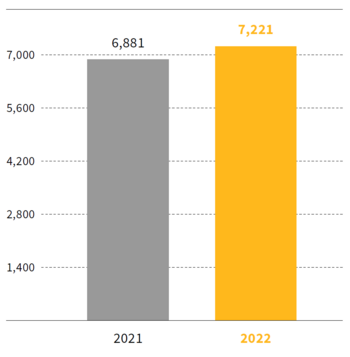
Order book (as at 31.12.) | 7,221,306 | 6,880,921 | 4.9 % | 8.5 % | ||||
Production output | 4,152,567 | 4,174,113 | (0.5 %) | 3.3 % | ||||
Workforce (FTE; as at 31.12.) | 7,639 | 7,653 | (0.2 %) |
1 Foreign currency adjusted
EBIT significantly increased to CHF 138.9 million (adjusted for currency effects CHF 144.1 million); free cash flow and equity ratio substantially higher
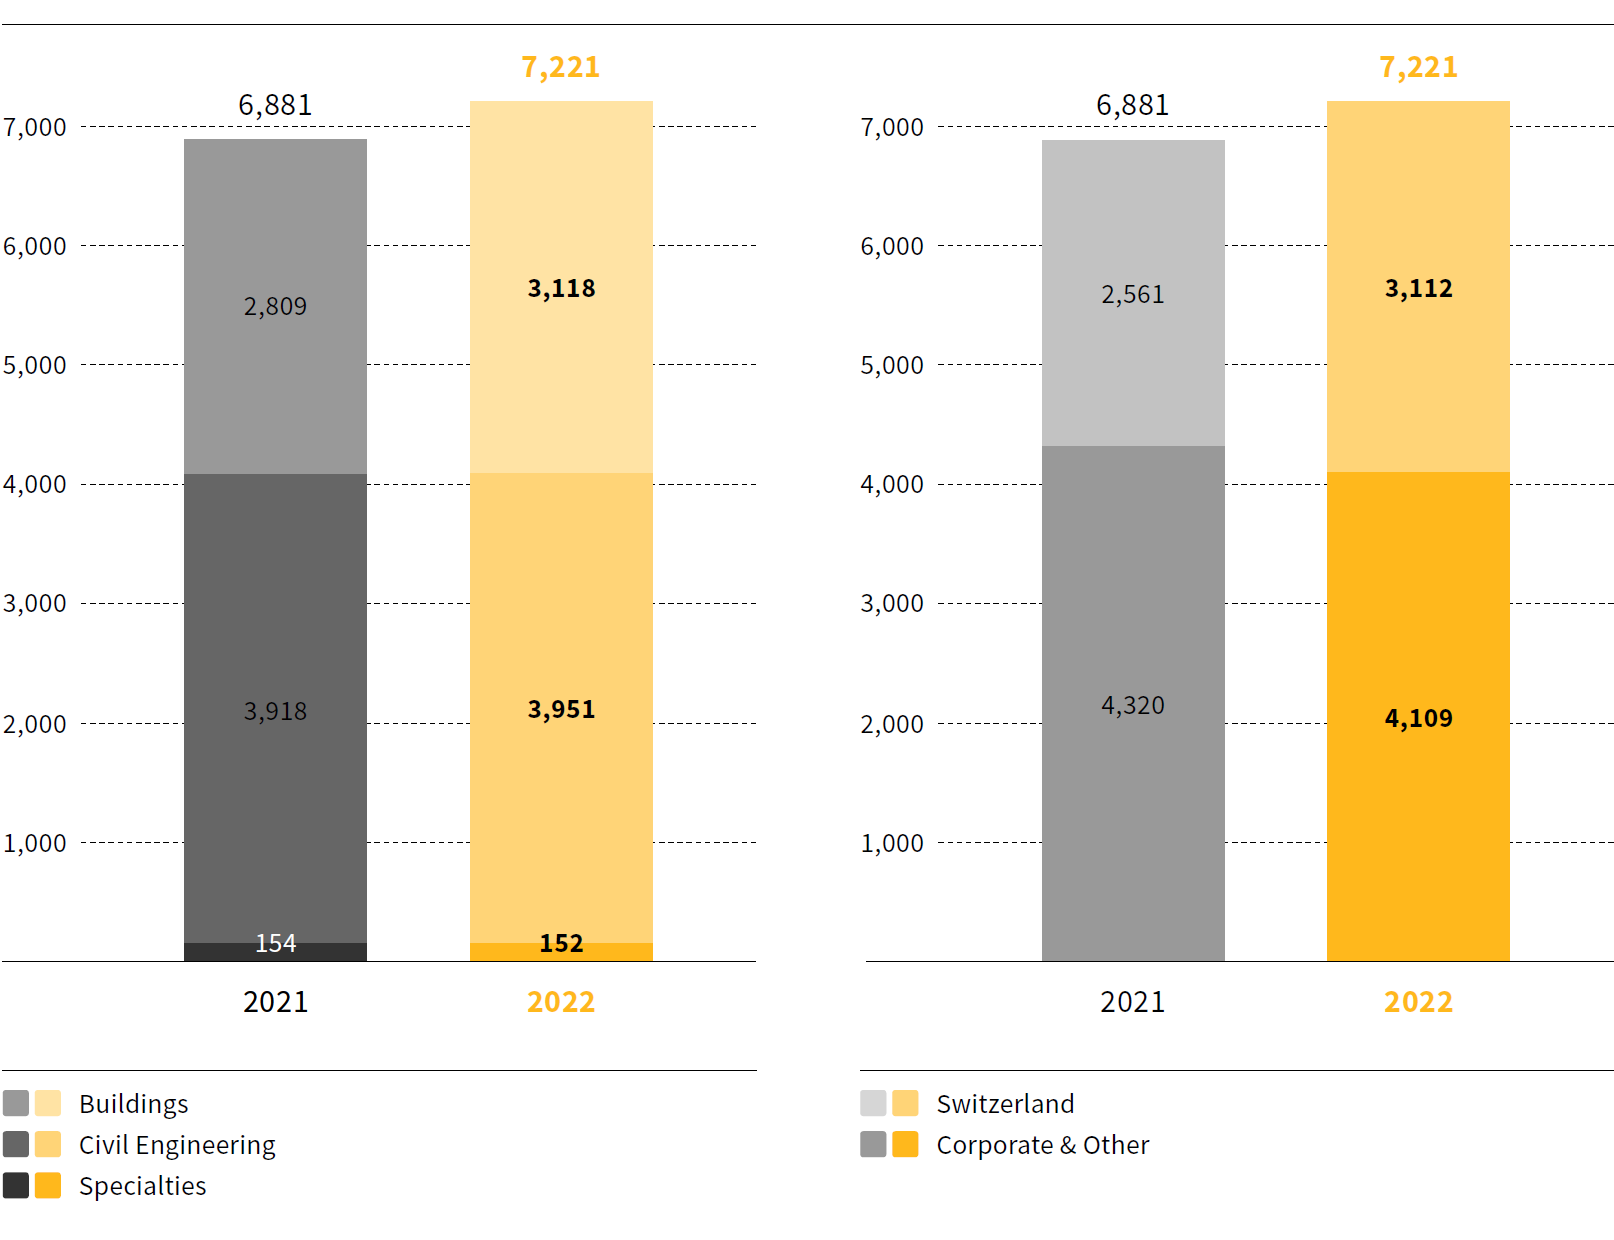
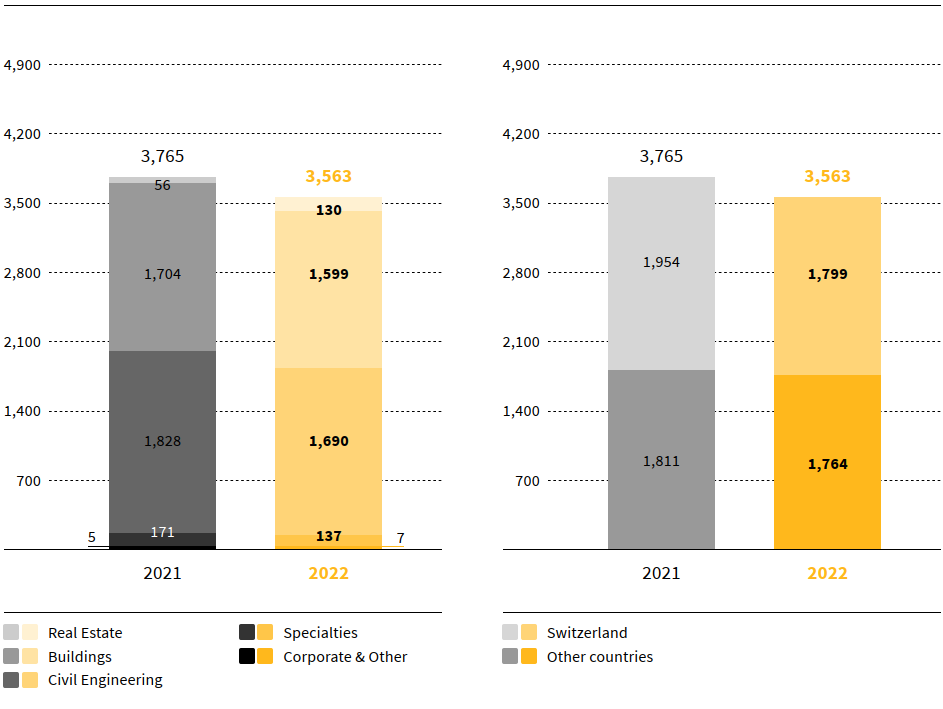
Implenia has significantly increased its EBIT to CHF 138.9 million (2021: CHF 114.8 million), or CHF 144.1 million adjusted for foreign currency effects. Group revenue was at CHF 3,563 million (2021: CHF 3,765 million) and remained at previous year’s level of CHF 3,716 million, adjusted for currency effects. The EBIT margin was 3.9% (2021: 3.1%). Due to the focus on large and complex real estate and infrastructure projects, the order book increased to CHF 7,221 million (2021: CHF 6,881 million), adjusted for currency effects to CHF 7,464 million. By strictly applying Value Assurance, Implenia’s risk management, the Group ensures that these projects have a solid risk and margin profile. Consolidated profit resulted in CHF 106.0 million (2021: CHF 64.0 million).
Implenia’s equity increased by CHF 136,8 million to CHF 482.7 million in financial year 2022 (2021: CHF 345.9 million). The equity ratio as of 31 December 2022 stood at 17.5% (2021: 11.6%). Total assets were reduced to CHF 2,753 million (2021: CHF 2,988 million) compared to previous year. Cash flow from operating activities increased to CHF 128,1 million (2021: CHF -69.2 million) and free cash flow to a high level of CHF 124.0 million (2021: CHF -17.5 million). Free cash flow was positively impacted by the operating business and successful management of net working capital. The net cash position improved to CHF 120.3 million (excl. leasing liabilities).
For 2023, Implenia is aiming for EBIT of CHF ~120 million and a further increase in the equity ratio to >20%
Implenia expects EBIT of CHF ~120 million for the financial year 2023 based on strong operating business at all Divisions. The EBIT contribution of Division Real Estate is likely to be considerably lower than in the previous year, especially in the first half year. In addition, Implenia expects the equity ratio to improve to >20% in 2023. Mid term, the Group aims to achieve an equity ratio of over 25%.
Implenia aims to achieve an EBIT margin of ~3.5% in the short to mid term and of >4.5% in the mid to long term.
Board of Directors will propose a dividend of CHF 0.40 per share to Annual General Meeting
Implenia wants its shareholders to participate in the company’s success following the completion of its transformation. Therefore, the Board of Directors will propose a dividend of CHF 0.40 per share to the AGM on 28 March 2023. The Board of Directors anticipates that Implenia will be able to continuously distribute dividends in the future.
Key balance sheet figures | ||||||
in TCHF | 31.12.2022 | 31.12.2021 | Δ | |||
Cash and cash equivalents and fixed short-term deposits | 609,040 | 796,895 | (23.6 %) | |||
Real estate transactions | 141,026 | 149,269 | (5.5 %) | |||
Other current assets | 1,084,524 | 1,136,534 | (4.6 %) | |||
Non-current assets | 918,836 | 905,138 | 1.5 % | |||
Total assets | 2,753,426 | 2,987,836 | (7.8 %) | |||
Financial liabilities | 654,479 | 888,453 | (26.3 %) | |||
Other liabilities | 1,616,277 | 1,753,465 | (7.8 %) | |||
Equity | 482,670 | 345,918 | 39.5 % | |||
Total equity and liabilities | 2,753,426 | 2,987,836 | (7.8 %) | |||
Net cash position excl. lease liabilities (as at 31.12.) | 120,336 | 67,319 | 78.8 % | |||
Investments in real estate transactions | 19,915 | 41,078 | (51.5 %) | |||
Investments in fixed assets | 44,238 | 42,653 | 3.7 % | |||
Equity ratio | 17.5 % | 11.6 % |
EBIT | ||||||
in TCHF | 2022 | 2021 | Δ | |||
Real Estate | 81,069 | 42,133 | 92.4 % | |||
Buildings | 35,372 | 32,352 | 9.3 % | |||
Civil Engineering | 35,751 | 51,776 | (31.0 %) | |||
Specialties | 4,412 | 8,764 | (49.7 %) | |||
Corporate and Other | (17,743) | (20,200) | 12.2 % | |||
EBIT Total | 138,861 | 114,826 | 20.9 % |
Order book
in CHF m
Consolidated Group revenue
in CHF m
Order book | ||||||
in TCHF | 31.12.2022 | 31.12.2021 | Δ | |||
Buildings | 3,118,421 | 2,809,189 | 11.0 % | |||
Civil Engineering | 3,950,989 | 3,918,114 | 0.8 % | |||
Specialties | 151,896 | 153,618 | (1.1 %) | |||
Total order book | 7,221,306 | 6,880,921 | 4.9 % |
Consolidated revenue | ||||||
in TCHF | 2022 | 2021 | Δ | |||
Real Estate | 144,818 | 82,120 | 76.3 % | |||
Buildings | 1,743,332 | 1,818,760 | (4.1 %) | |||
Civil Engineering | 1,920,749 | 2,060,672 | (6.8 %) | |||
Specialties | 163,977 | 208,583 | (21.4 %) | |||
Corporate and Other / elimination of intra Group services | (409,610) | (405,465) | (1.0 %) | |||
Total consolidated revenue | 3,563,266 | 3,764,670 | (5.3 %) |
Invested capital | ||||||
in TCHF | 31.12.2022 | 31.12.2021 | Δ | |||
Current assets (excl. cash and cash equivalents and fixed short-term deposits) | 1,225,550 | 1,285,803 | (4.7 %) | |||
Non-current assets (excl. pension assets and rights of use from leases) | 761,735 | 755,765 | 0.8 % | |||
Debt capital (excl. financial and pension liabilities) | (1,606,375) | (1,737,839) | 7.6 % | |||
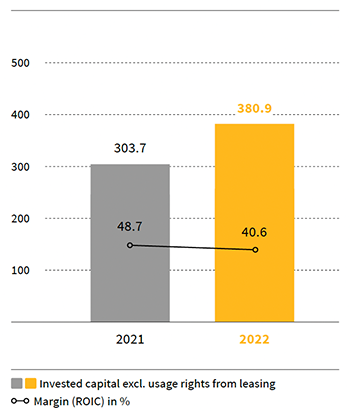
Total invested capital excl. rights of use from leases | 380,910 | 303,729 | 25.4 % | |||
Rights of use from leases | 156,657 | 148,929 | 5.2 % | |||
Total invested capital1 | 537,567 | 452,658 | 18.8 % |
1 Debt capital (excl. financial and pension liabilities) excl. Rights of use from leases includes provisions for onerous lease contracts that under IFRS 16 are reflected as impairment on the right of use asset (see note 18).
